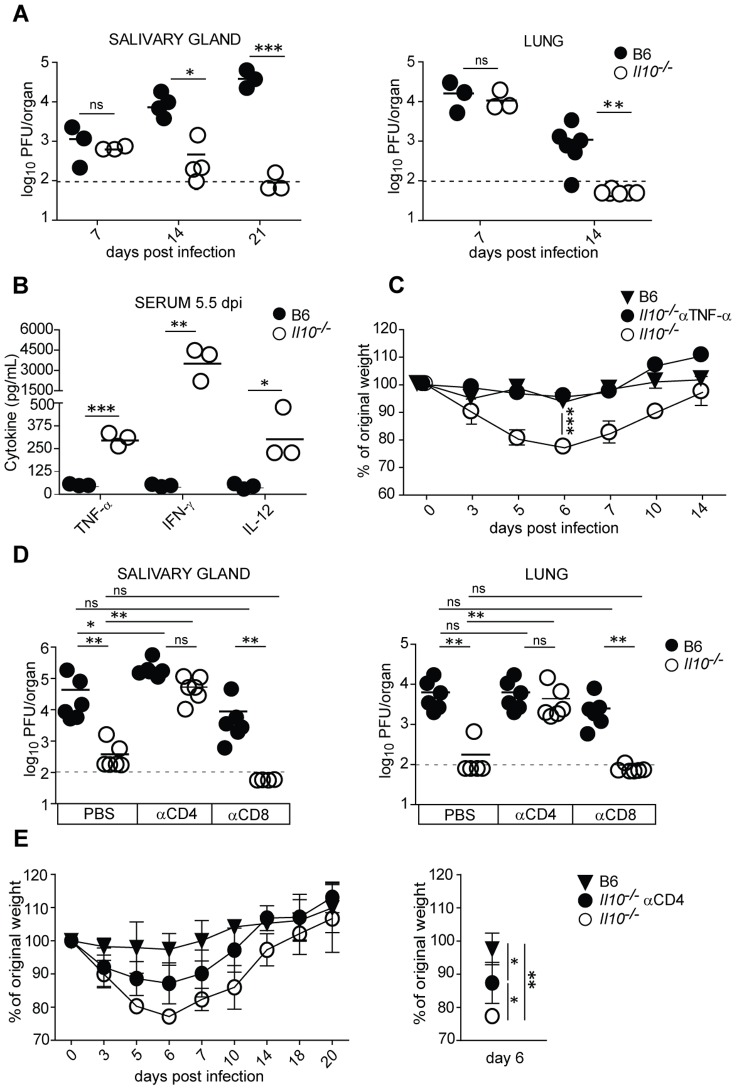
Figure 1. Il10 −/− mice show reduced virus loads and increased body weight loss during acute MCMV infection.
B6 and Il10 −/− mice were infected i.v. with 5×10⁶ PFU Δm157 MCMV. A) Virus titers on different days post infection were determined in lungs and salivary glands. Each symbol represents one individual mouse, horizontal line indicates the mean (n = 3–6, dashed line indicates detection limit). Data are representative of 3 independent experiments. B) IFN-γ, TNF-α and IL-12 protein concentrations were determined in the sera of B6 and Il10 −/− mice at day 5.5 post infection by cytometric bead array (BD, Bioscience) and murine IL-12 ELISA Kit (Peprotech). Each symbol represents one individual mouse, horizontal line indicates the mean (n = 3). Data are representative of 2 independent experiments. C, E) Body weight change of B6 and Il10 −/− mice was measured up to 14 or 20 days post infection. Change in percentage of body weight relative to day 0 is shown. One group of Il10 −/− mice was treated with a neutralizing anti-TNF-α antibody (C) or depleted of CD4 T cells (E). Right panel in E indicates the same experiment showing significances for day 6 p.i. Data are representative of 3 independent experiments. Each symbol represents the mean of 3 mice per group, error bars indicate the standard deviation. D) Virus titers in lungs and salivary glands on day 14 post infection of B6 and Il10 −/− mice with or without depletion of CD4 or CD8 T cells. Each symbol represents one individual mouse, horizontal line indicates the mean (n = 5–7, dashed line indicates detection limit). Pooled data from 2 independent experiments are shown. Statistical analysis was performed by 2-tailed unpaired student's t-test (* p<0.05, ** p<0.01, *** p<0.001).

