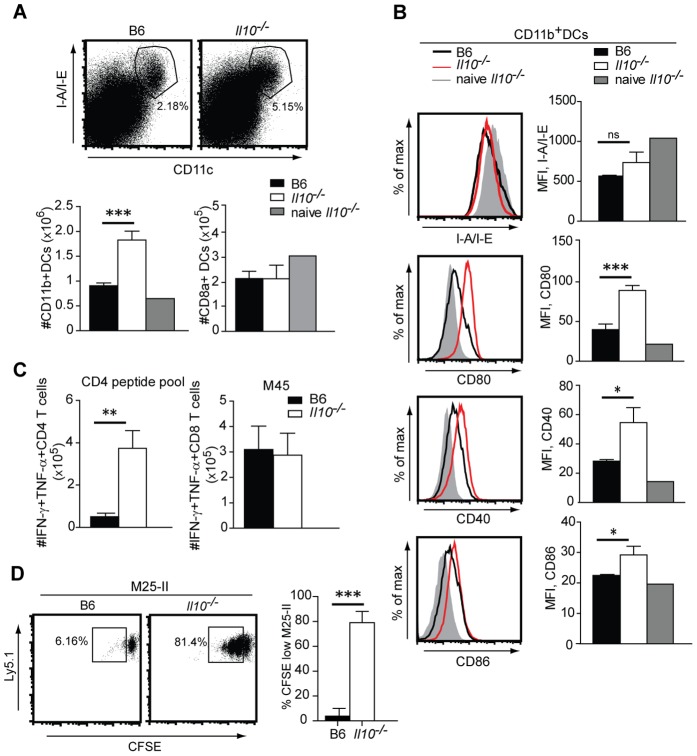
Figure 3. IL-10 alters the phenotype and function of DCs.
B6 and Il10 −/− mice were infected with 5×10⁶ PFU Δm157 MCMV. A) Splenocytes from infected mice were isolated at day 5.5 p.i. Representative FACS plots showing CD11c and I-A/I-E stainings of total spleen leukocytes (upper row). Total numbers of CD11c+CD8α−CD11b+MHCII+B220− DCs and CD11c+CD8α+MHCII+B220− DCs from infected B6 and Il10 −/− mice and naive Il10 −/− mice are shown (lower row, n = 3 except for naive Il10 −/− mice n = 1; data are representative for at least 3 experiments, error bars indicate the standard deviation). B) Expression levels of I-A/I-E and costimulatory molecules CD80, CD86 and CD40. Plots are gated on CD11c+CD8α−MHCII+B220−DC population at day 5.5 p.i. are shown (n = 3, error bars indicates standard deviation, data are representative from at least 3 experiments). Representative FACS pots (left column) and summary of MFI data (right column). C) Lung lymphocytes were isolated at day 5.5. p.i. and CD4 T cells were restimulated with a pool of M14, m18, M25, M112, m139 and m142 peptides (CD4 peptide pool) and CD8 T cells were restimulated with M45 peptide. Total numbers of IFN-γ+ TNF-α+ peptide specific CD4 and CD8 T cells are shown (n = 3, error bars indicate standard deviation, data are representative from at least 3 experiments). D) Splenic CD11c+ cells isolated at day 3.5 p.i. from B6 and Il10 −/− mice were enriched by MACS, loaded with M25 peptide and incubated with the naive MACS purified CFSE labeled TCR transgenic CD4 T cells specific for the M25 protein (M25-II cells) for 3 days. The frequencies of CFSElow M25 II cells are indicated in the representative FACS plot. (n = 3 triplicates of respective cell cultures, data are representative of 3 independent experiments). Statistical analysis was performed by 2-tailed unpaired student's t-test (* p<0.05, ** p<0.01, *** p<0.001).

