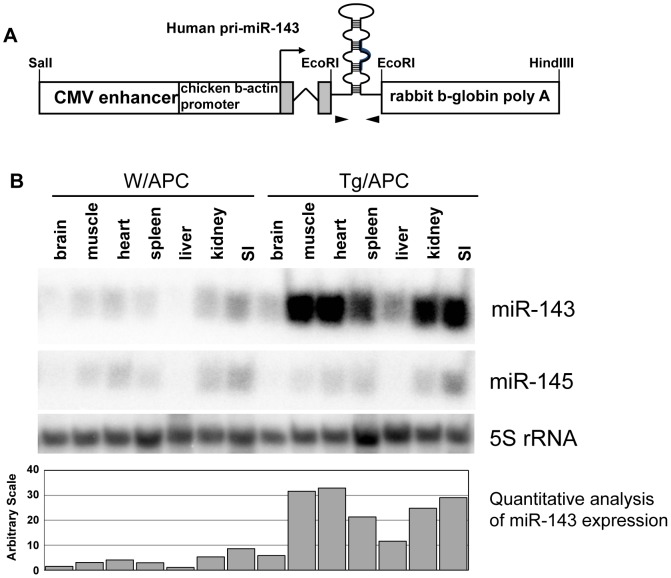
Figure 1. Establishment of CAG/miR-143 transgenic mice and Northern blot analysis.
A) Schematic depiction of the DNA construct and its possible transcript. ∼2.6 kb SalI and HindIII fragment of CAG/miR-143 was injected to mice eggs. The shadow boxes and a bent arrow represent the 5′untranslated region and a possible transcriptional start site, respectively. Approximate positions of primers for genotyping (arrowheads) are shown. B) Polyacrylamide gel Northern blot analysis of various tissues of the transgenic mouse. Twenty µg of total RNA of various tissues from a transgenic mouse (Line C) and its normal littermate was applied in each lane. The membrane was hybridized with the probes for miR-143(1st panel), miR-145 (2nd panel) and 5S rRNA (3rd panel). The 4th panel represents quantitative analysis of miR-143 expression in the 1st panel. SI: small intestine.

