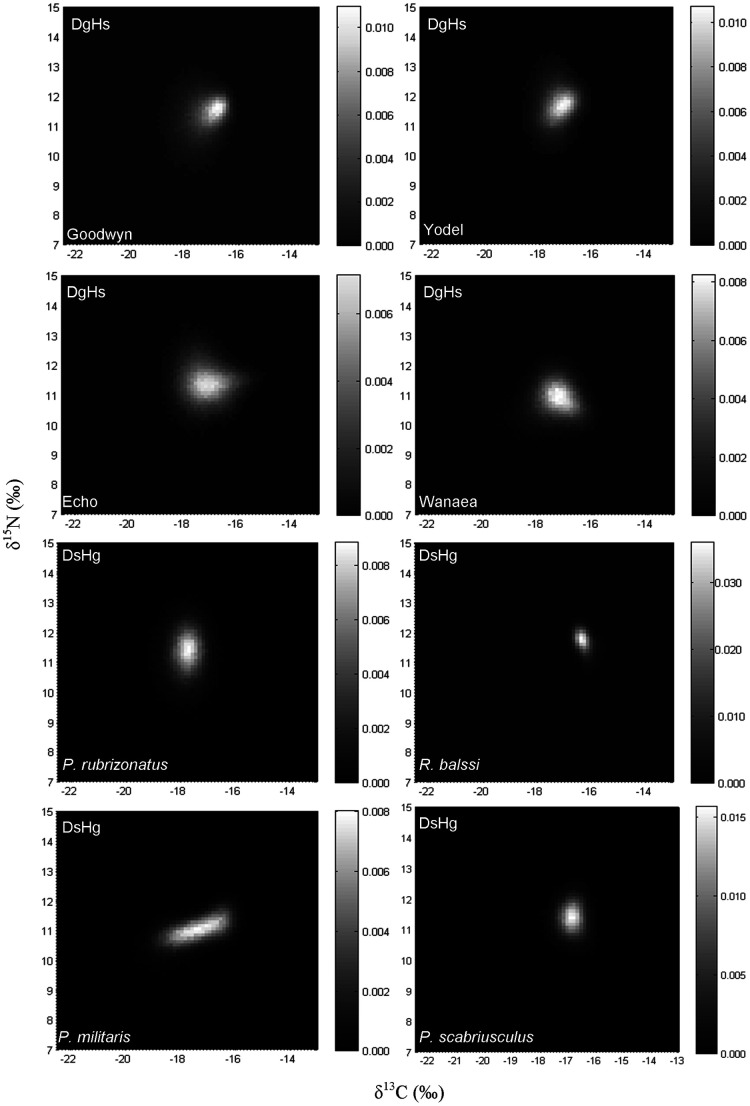
Figure 1. 2D histograms showing the distribution of the results obtained for 100 000 of the isotopic signatures from the modelled Almaco Jack in δ-space for the common species (Part 1) for dietary generalists and habitat specialists (DgHs) and dietary specialists and habitat generalists (DsHg).
Individual histogram greyscale bars indicate the relative frequency for each class.

