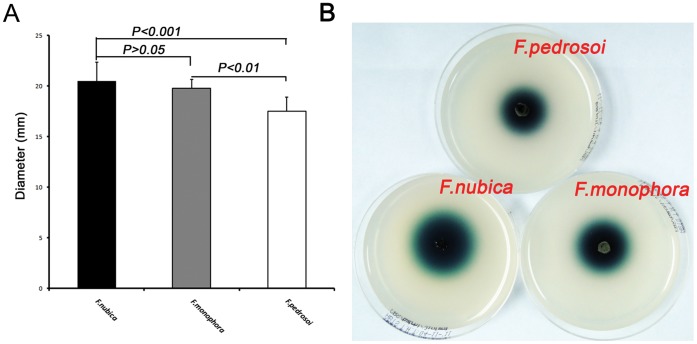
Figure 3. Laccase activity assay.
Colored metabolite diameters of tested strains were measured after 7-day culture at 25°C on solid MM medium with 5 mM ABTS. Statistical analysis shown as mean ± standard deviation (A). The plates show the generation of colored metabolite compound (B), F. pedrosoi (CBS 273.66), F. monophora (CBS 117236), F. nubica (CBS 121720).

