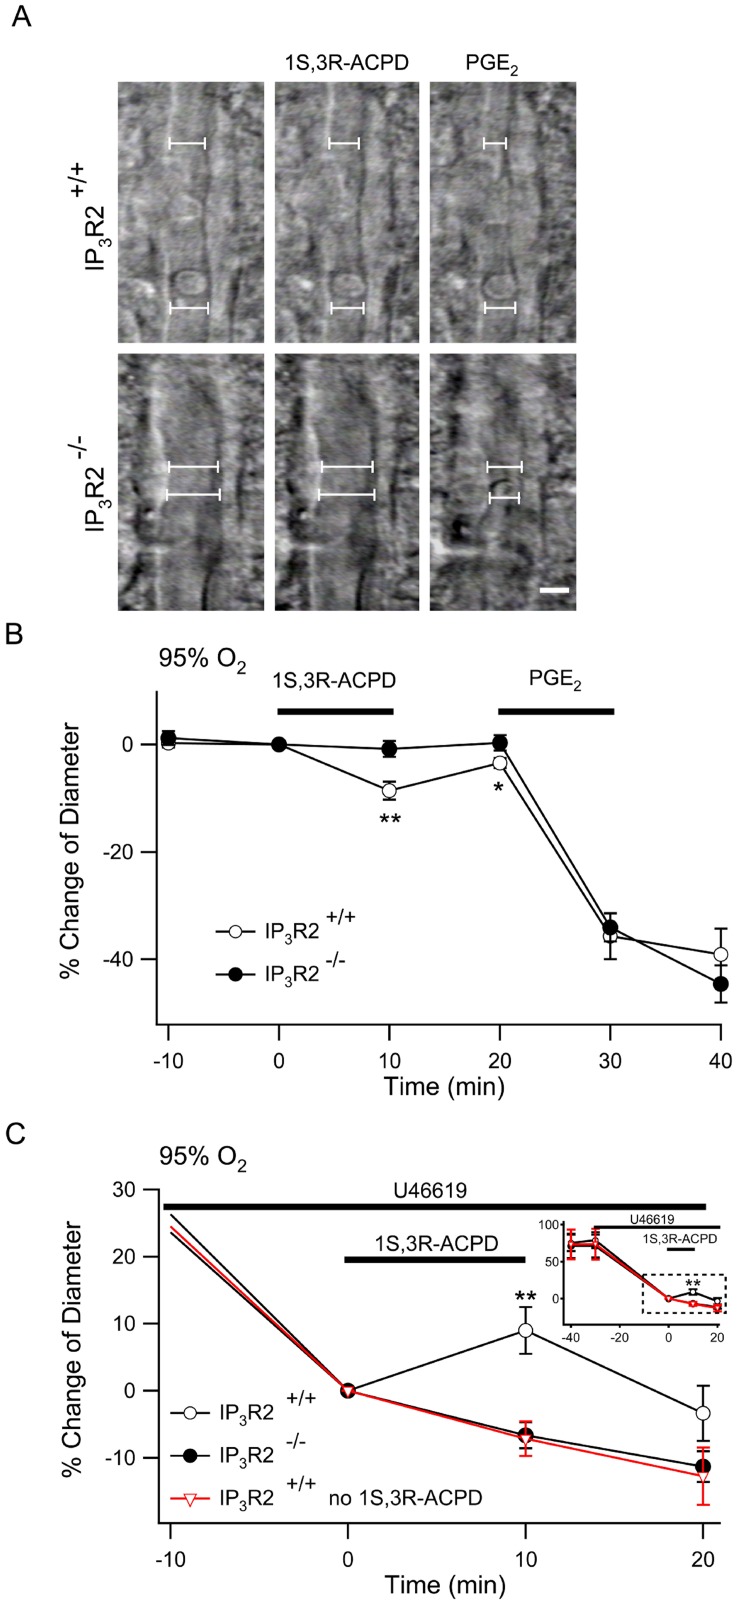
Figure 2. Arteriole responses to mGluR agonist application are eliminated in IP3R2−/− neocortical slices.
A. Gradient contrast imaging was used to measure arteriole responses to treatment. Responses to 1S,3R-ACPD were quantified by defining 6 points (2 of the points are shown in this figure) at which to measure changes in arteriole diameter over time (described in Methods). The arteriole diameter is expressed as the average diameter of the points. Scale bar: 5 µm. B. Cortical slices from IP3R2+/+ (open circle, n = 18) and IP3R2− /− (filled circle, n = 24) were treated with 1S,3R-ACPD followed by PGE2 and arteriole responses were measured. C. During continuous application of U-46619 the IP3R2+/+ and IP3R2− /− were treated with 1S,3R-ACPD while another group of IP3R2+/+ slices were treated with vehicle instead of 1S,3R-ACPD (red inverted triangle, n = 7). Inset shows the complete experiment from the time of application of U-46619. The dashed white box indicates the expanded graph. Treatment with U-46619 (100 nM) constricted arterioles of both IP3R2+/+ (n = 16) and IP3R2− /− slices (n = 17) to a similar extent. **, P<0.01 comparing IP3R2+/+ to IP3R2− /−10 min following 1S, 3R-ACPD application.

