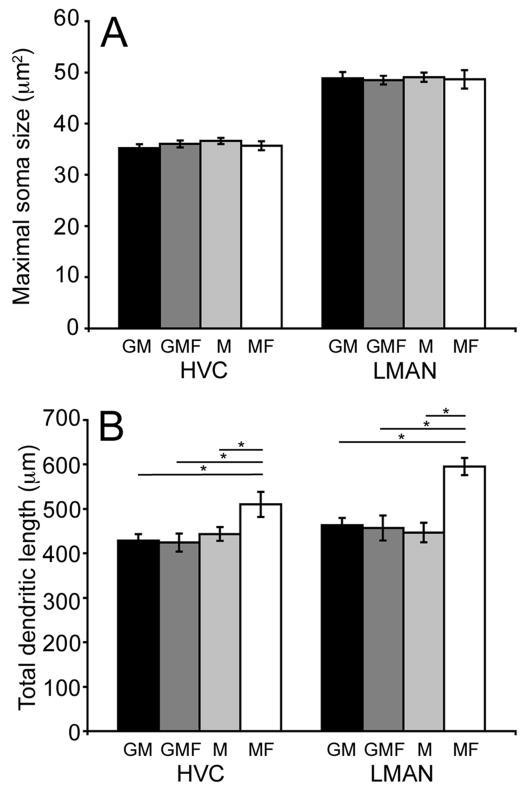
Figure 5.
Total dendritic length varied as a function of social housing condition. (A) Mean (±SEM) cross-sectional soma area of cells in HVC-RA and LMAN-RA. In HVC, average soma size did not vary significantly across the four social groups: group housed males (GM; black bars), group housed males with females (GMF; dark grey bars), individually housed males (M; light grey bars), males housed in male-female pairs (MF; white bars). In LMAN, average soma size did not vary significantly across the four social housing conditions. (B) Mean (±SEM) total dendritic length of cells in HVC-RA and LMAN-RA. In HVC, average total dendritic length was significantly larger in MF individuals compared to the three other social housing conditions (GM, GMF & M) (p≤0.04). In LMAN, average total dendritic length was significantly larger in MF individuals compared to the three other social housing conditions (GM, GMF & M) p≤0.0005).

