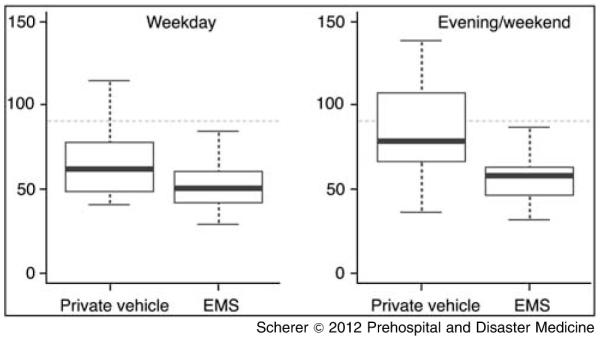
Figure 1.

Box plots representing Median D2B times on Weekday and Weekend/Evening ED arrivalsa
aBoxplots illustrate the distribution of D2B time across mode of transport on weekdays (left) and weekend/evenings (right). Boxplots illustrate the typical five number summaries of the data (minimum, lower hinge, median, upper hinge, maximum). Dashed line represents the AHA-recommended 90-minute benchmark for STEMI revascularization.
