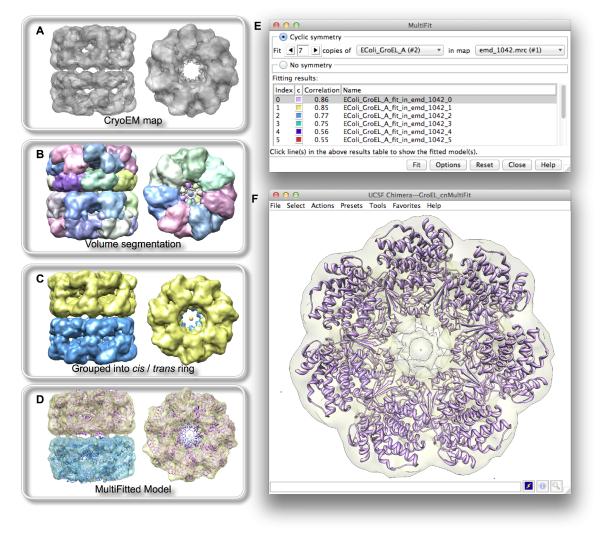
Figure 2.
MultiFit GUI and multiple fitting of GroEL subunits into EM maps. (A) Cryo-EM map of the apo form of GroEL. (B) Cryo-EM map separated and colored by Chimeras Segment Map tool. (C) Segmentation regions grouped and merged into cis and trans rings. (D) Multiple subunits placed within the segmented map according to one of the solutions from MultiFit. (E) Chimera’s MultiFit interface, showing fitting with cyclic symmetry. The table lists solutions to the multiple fitting problem and their correlation coefficient values. (F) The EM map and top-scoring solution (index 0 in the table) are shown in Chimeras 3D graphics window.

