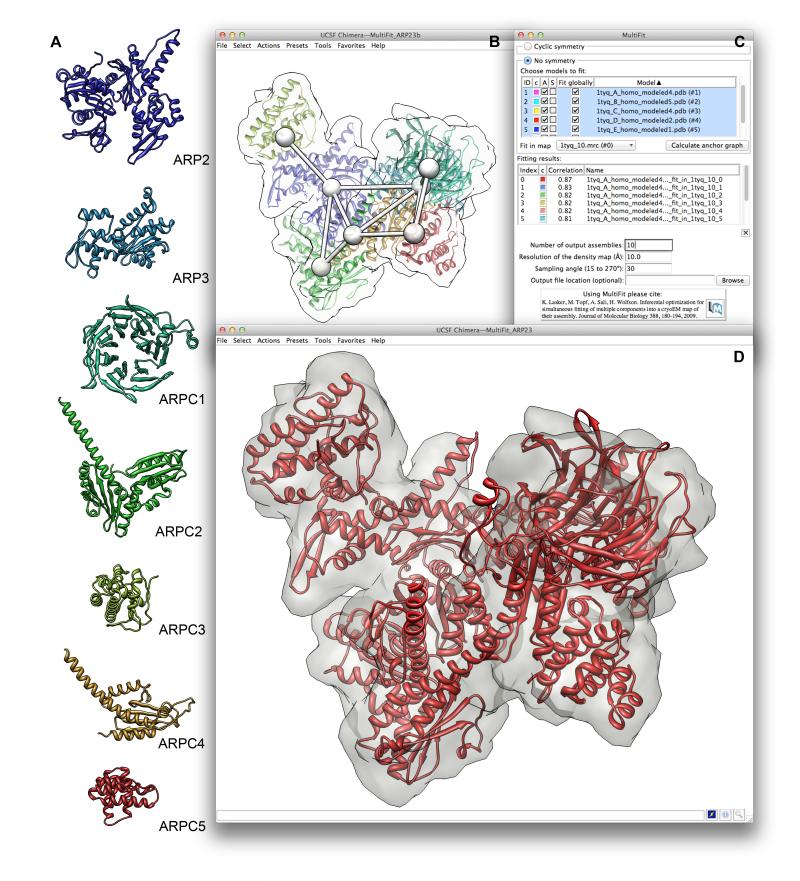
Figure 5.
(A) Comparative models of the ARP2/3 subunits. The seven subunits of the ARP2/3 complex are modeled using MODELLER based on multiple templates. (B) Anchor graph of the ARP2/3 complex as generated by MultiFit for the density map simulated from crystal structure 1TYQ. 1TYQ is also shown, with subunits colored uniquely. (C) Chimera’s MultiFit interface, showing fitting without symmetry. The table lists solutions to the multiple fitting problem and their correlation coefficient values. (D) The top-scoring MultiFit model within the density map simulated from 1TYQ.

