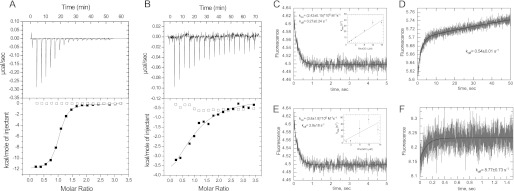
FIGURE 1.
Interaction analysis of RhoGDI with unprenylated RhoA. A, representative ITC data for titration of 10 μm RhoGDI with either 160 μm RhoA·GDP (filled squares) or buffer (open squares). Solid curve represents a fit of the data to a 1:1 stoichiometry binding model with a calculated Kd value 213 nm; B as in A except that RhoGDI was titrated with 130 μm RhoA·GMPPNP (filled squares) or buffer (open squares). The fit resulted in a Kd value of 5.7 μm. C, kinetic analysis of the RhoGDI interaction with unprenylated RhoA·mGDP. A typical fluorescence change observed upon mixing 0.4 μm RhoAmGDP with 8 μm RhoGDI. The inset represents a plot of the observed rates as function of RhoGDI concentration. D, fluorescence change upon mixing of 0.4 μm RhoA·mGDP·RhoGDI complex with 5 μm RhoA·GDP. E, fluorescence change resulting from mixing of 0.4 μm RhoA·mGMPPNP with 12 μm RhoGDI. The inset represents the plot of observed rates as a function of RhoGDI concentration. F, fluorescence change upon mixing of 1.2 μm RhoA·mGMPPNP·RhoGDI with 20 μm RhoA·GMPPNP.

