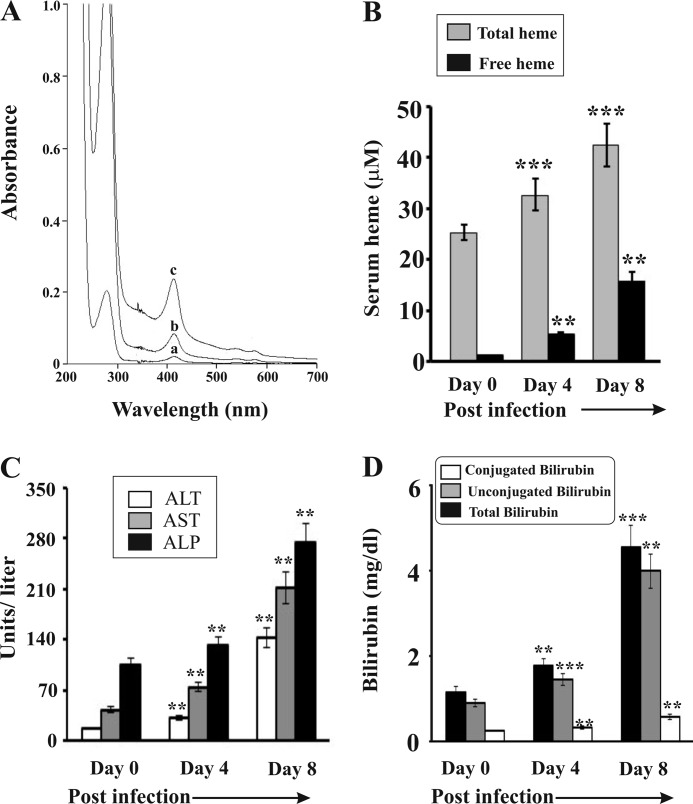
FIGURE 1.
Hemolysis and liver dysfunction in malaria-infected mice. A, Soret spectroscopy of serum of malaria-infected mice on day 0 (a), day 4 (b), and day 8 (c) postinfection. B, measurement of heme in serum of malaria-infected mice on day 0, 4, and 8 postinfection. C, measurement of the activities of ALT, AST, and ALP in serum of malaria-infected mice on day 0, 4, and 8 postinfection. D, measurement of total, unconjugated, and conjugated bilirubin in serum of malaria-infected mice on day 0, 4, and 8 postinfection. Malaria-infected mice on day 0 is considered as control. The details of the methodology are described under “Experimental Procedures.” Data are presented as mean ± S.E. (**, p < 0.01 versus control; ***, p < 0.001 versus control, n = 6).

