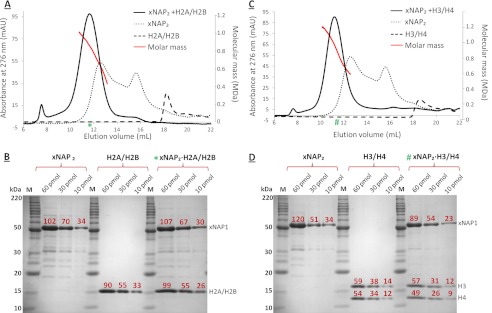
FIGURE 1.
xNAP2-histone complex formation. Analytical SEC was used to monitor complex formation of the xNAP2-histone complexes at 150 mm NaCl. Elution profiles were overlaid to allow for direct comparison of the individual components and their resulting complexes: xNAP2-H2A/H2B (A) and xNAP2-H3/H4 (C). SEC-MALLS was performed on each xNAP2-histone complex, and the corresponding molar mass curves are shown in red. Staining efficiencies of xNAP2 and histones were measured by performing densitometry on SDS-PAGE bands at three different concentrations as indicated in B and D. To determine the stoichiometry of the eluting xNAP2-histone complexes, the peak fraction (green asterisk or number sign for each complex, respectively) was analyzed by SDS-PAGE at three concentrations as indicated in B and D. The total integrated intensity is shown above each band in red. mAU, milli-absorbance units.

