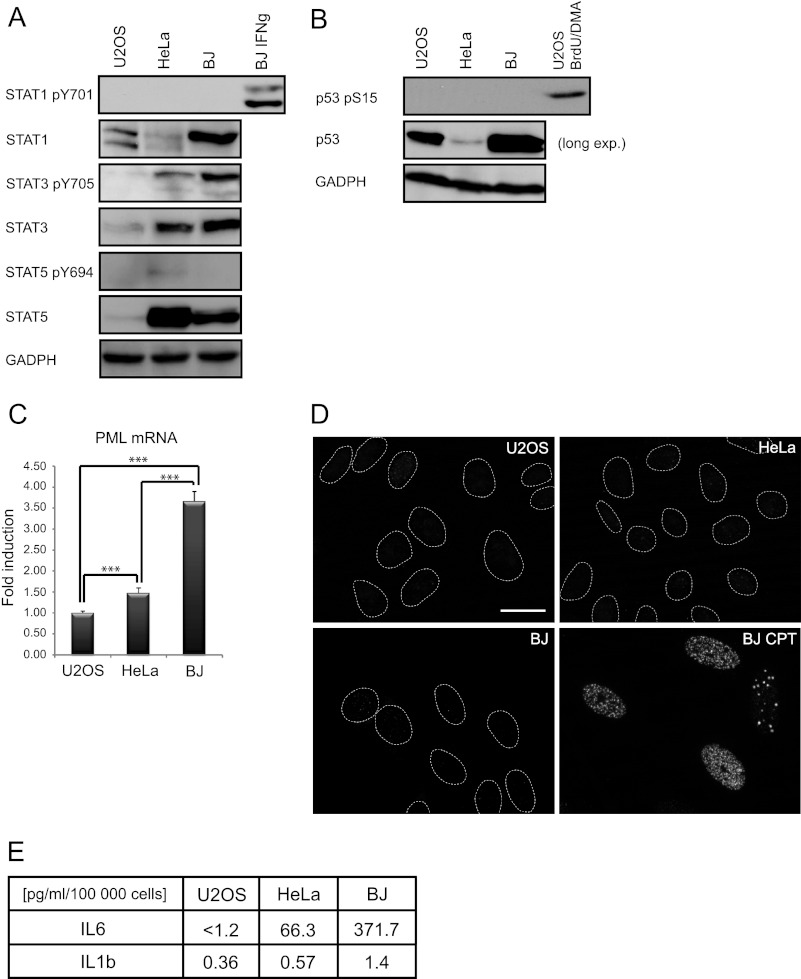
FIGURE 2.
Cell type-dependent differences in IL6-STAT3 activity and expression of PML. A, shown is immunoblot detection of total STAT1, STAT3, STAT5, tyrosine 701-phosphorylated STAT1, tyrosine 705-phosphorylated STAT3, and tyrosine 694-phosphorylated STAT5 in U2OS, HeLa, and BJ cells cultivated at standard conditions and BJ exposed to IFNγ (10 IU/ml) for 24 h (included as a positive control of STAT1 activation); GAPDH was used as a loading control. B, shown is immunoblot detection of total and p53 serine 15-phosphorylated p53 in U2OS, HeLa, and BJ cultivated at standard conditions; U2OS cell treated with a combination of 10 μm BrdU and 10 μm distamycin A (BrdU/DMA) are included as positive control; GAPDH was used as a loading control. C, PML mRNA levels were detected by real time qRT-PCR in U2OS, HeLa, and BJ cells cultivated at standard conditions. The values represent the average of two independent experiments performed in triplicate and are given as the -fold induction of PML mRNA levels relative to U2OS; β-catenin (CTNNB1) was used as a reference gene. Asterisks (***) represent a p value <0.005. D, shown is immunofluorescence detection of endogenous level of γH2AX, a marker of DNA damage response, in U2OS, HeLa, and BJ cells. BJ treated for 4 days with camptothecin (BJ CPT) were used as a positive control of γH2AX formation. Bar, 15 μm. E, shown is an estimation of IL6 and IL1β in medium of U2OS, HeLa, and BJ cells measured by FACS beads.

