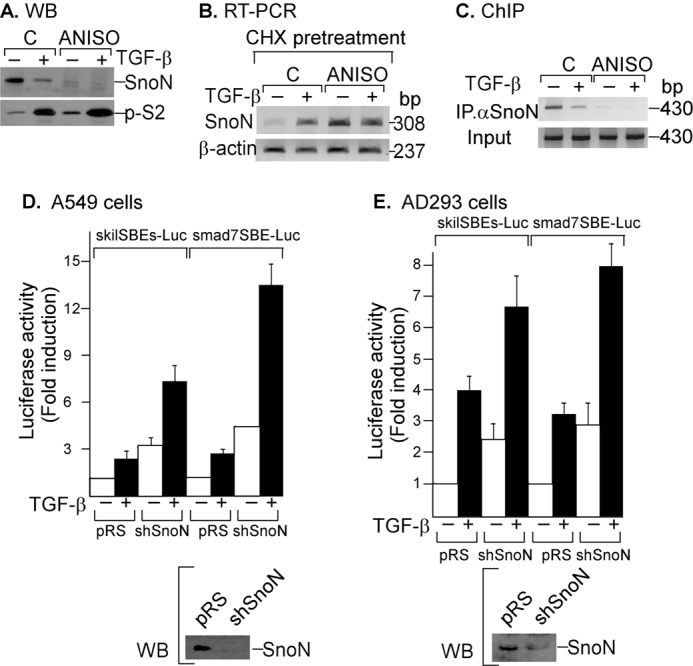
FIGURE 5.

SNON negatively self-regulates its expression at the transcriptional level. A, A549 cells were preincubated for 1 h in the absence or presence of 10 μm ANISO and then incubated for 45 min with or without 300 pm TGF-β. Whole cell protein extracts were immunoprecipitated with specific anti-SNON and anti-S2/S3 antibodies and then analyzed by immunoblotting with specific anti-SNON and anti-phospho-SMAD2 (p-S2) antibodies. B, A549 pretreated with cycloheximide (CHX) for 20 min were then preincubated for 1 h in the absence or presence of 10 μm ANISO and then incubated for 2 h with or without 300 pm TGF-β (n = 2). Total RNA was isolated, and RT-PCR was performed with specific primers for SNON and β-actin. C, A549 cells were pretreated for 1 h without or with 10 μm ANISO and then treated for 45 min with or without 500 pm TGF-β, and a ChIP assay was carried out using anti-SNON antibody for IP (n = 3). PCRs were done with primers spanning the SKIL SBE region. A549 (D) or AD293 (E) cells stably expressing an shRNA to knock down SNON were co-transfected with the skilSBEs(408)-Luc or smad7SBE-Luc reporter plasmid, and 24 h post-transfection, cells were incubated for 12 h in the absence or presence of 100 pm TGF-β. Luciferase activity was normalized using β-gal expression and is reported as -fold induction over control (C). Values are mean ± S.E. (error bars) of three separate experiments in triplicate (upper panels). Endogenous SNON protein levels were detected in each cell type by Western blot (lower panels).
