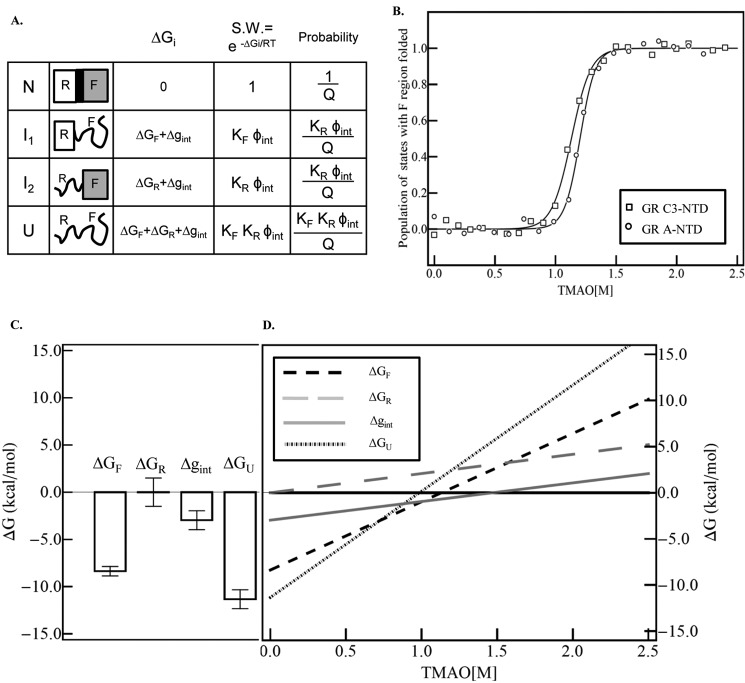
FIGURE 6.
A, schematic representation of the ensemble model of allosteric regulation in full-length GR NTD containing the R region and F region. Each region can be folded or unfolded, resulting in four possible states (i.e. N, I1, I2, and U) (42). S.W. is the statistical weight of each state. Q is the partition function, which is the sum of the statistical weights of all the states in the ensemble. KF and KR are equilibrium constants between the folded and unfolded state for F and R region, respectively, i.e., KF = Exp(−ΔGF/RT), KR = Exp(−ΔGR/RT). Φint is the statistical weight of the interaction between R and F region, Φint = Exp(−Δgint/RT). B, dependence of the population of the states with F region folded (i.e. N and I2) on TMAO concentration. Raw data for GR A-NTD (open squares) and GR C3-NTD (open triangles) are calculated from the TMAO folding curve as shown in Fig. 2. The underlying assumption made is that the fully unfolded state U and the intermediate state I1 (where the F region is unfolded) have the same fluorescence emission intensity (set to 0) and that the fully folded state N and the intermediate state I2 (wherein the F region is folded) have the same fluorescence emission intensity (set to 1) as both of the two NTD tryptophans are in the F region. The fitted curve is based on the linear extrapolation method, fitting to the equation Observable = PN + PI1. The fitted parameters are as follows: ΔG0F→U (F) = −8.4 ± 0.5 kcal/mol, m (F) = 7.4 ± 0.4 kcal/(mol × m); ΔG0F→U (R) = 0 kcal/mol, m (R) = 2.1 ± 0.4 kcal/(mol × m); Δg0int = −3.0 ± 1.0 kcal/mol, and mint = 2.0 ± 0.9 kcal/(mol × m). C, histogram plot of the extrapolated values for stabilities of the F region (ΔGF), R region (ΔGR), the interaction energy (Δgint), and the calculated free energy value for the fully unfolded state U (ΔGU = ΔGF + ΔGR + Δgint). D, dependence of the free energy of the F region, R region, interaction interface, and fully unfolded state on TMAO concentration, based on the fitted parameters from Fig. 6B.

