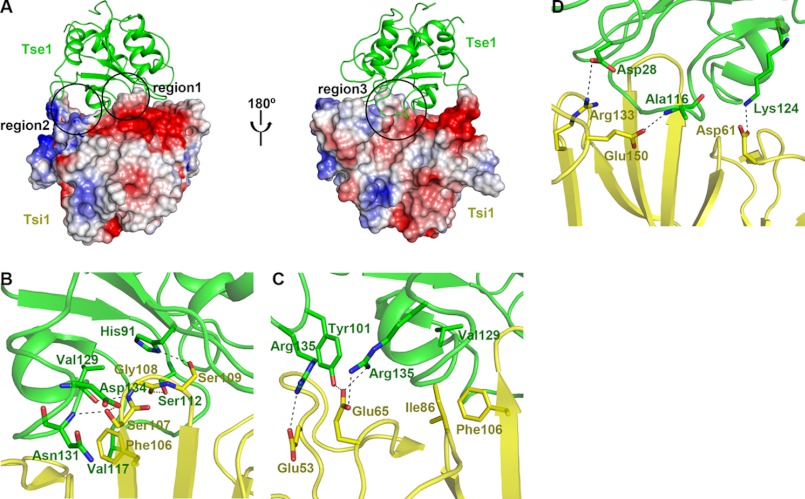
FIGURE 5.
Tsi1-Tse1 interaction. A, two opposite views of the interface between Tse1 and Tsi1. Tse1 is shown as a ribbon diagram in green. The electrostatic potential of Tsi1 is depicted with surface coloration from red to blue for negatively to positively charged regions. B–D, close-up view of the three contacting regions. All of the interacting residues are labeled and shown as stick models (Tse1 in green and Tsi1 in yellow). Hydrogen bonds and salt bridges are shown as black dashed lines.

