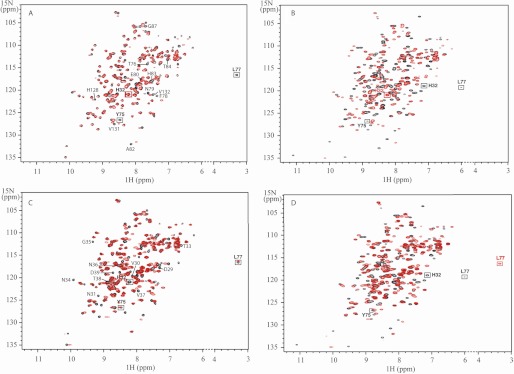
FIGURE 2.
Superimposition of 15N-1H HSQC spectra. A, GaPPIX-Y75A (red) versus GaPPIX-HasAWT (black). 15N-1H correlations of residues of loop L2 and residues 87, 128, 131, and 132 of GaPPIX-HasAWT are indicated. B, GaPPIX-Y75A (red) versus apo-HasAWT (black). C, GaPPIX-H32A (red) versus GaPPIX-HasAWT (black). 15N-1H correlations of residues localized in the central part of the L1 loop, from Asp29 to Asp39, of GaPPIX-HasAWT are indicated. D, GaPPIX-H32A (red) versus apo-HasAWT (black). Spectra were recorded at 303 K, at pH 5.6 in 20 mm sodium phosphate buffer.

