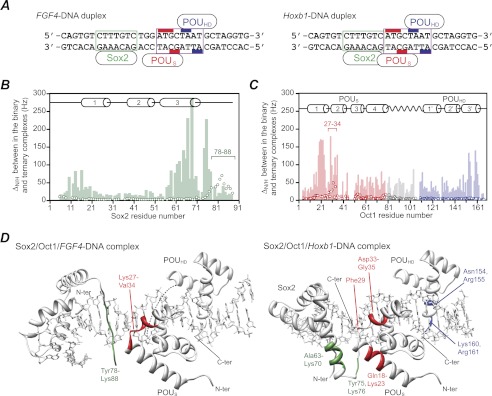
FIGURE 1.
Comparison of chemical shift mapping of the protein/protein interaction surfaces at the Sox2 and Oct1 interfaces in the Sox2·Oct1·FGF4-DNA and Sox2·Oct1·Hoxb1-DNA ternary complexes. A, FGF4 (left) and Hoxb1 (right) DNA duplexes. The Sox2 and Oct1 binding sites are delineated by the boxes in green and purple, respectively. The bases that interact with the POUS and POUHD domains of Oct1 are indicated by the red and blue bars, respectively. The Hoxb1-DNA duplex represents the actual sequence from the Hoxb1 promoter (18). The FGF4-DNA duplex is not the actual sequence present in the FGF4 enhancer but simply represents the Hoxb1 sequence with the 3-bp insertion between the Sox2 and Oct1 sites from the FGF4 enhancer element. As explained under “Results”, this was done to ensure that differences in equilibrium and kinetic rate constants reflect only the different spacing of the Sox2 and Oct1 sites. B and C, profiles of backbone 1HN/15N chemical shift differences (ΔH/N) between the ternary and binary complexes on the FGF4-DNA (open circles) and Hoxb1-DNA (light bar) duplexes for Sox2 (green) (B) and Oct1 (red, POUS domain; blue, POUHD domain; gray, linker) (C). ΔH/N is calculated from ((ΔνH)2 + (ΔνN)2)½ in Hz at a 1H frequency of 600 MHz. D, residues showing significant 1HN/15N chemical shift perturbations mapped onto the structures of the Sox2·Oct1·FGF4-DNA (left, ΔH/N > 20 Hz, Protein Data Bank (PDB) code 1gt0 (8)) and Sox2·Oct1·Hoxb1-DNA (right, ΔN/H > 100 Hz, PDB code 1o4x (7)) ternary complexes. C-ter, C terminus; N-ter, N terminus.

