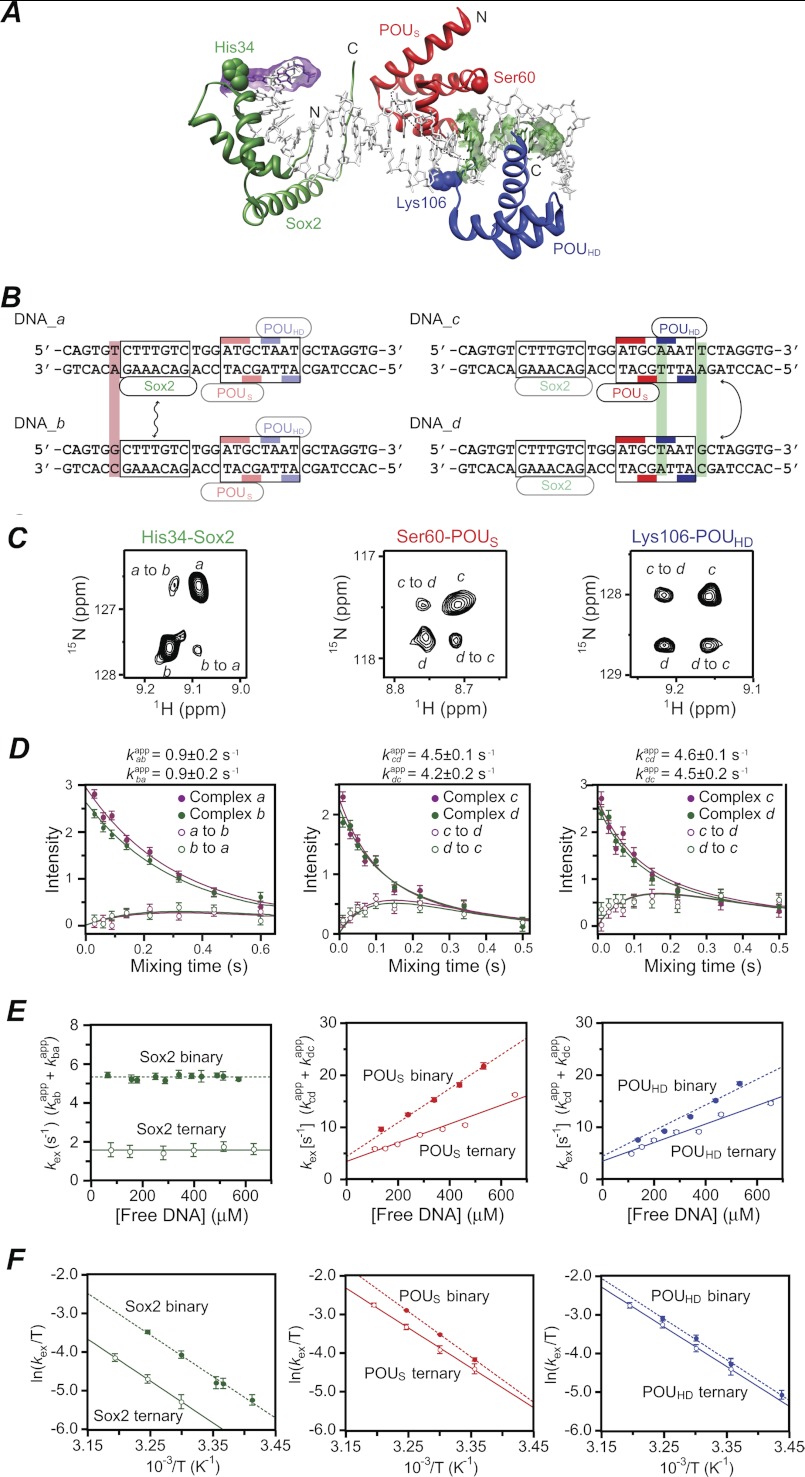
FIGURE 3.
Global intermolecular translocation of Sox2 and Oct1 between Sox2·Oct1·FGF4-DNA complexes. A, ribbon diagram of the crystal structure of the Sox2·Oct1·FGF4-DNA complex (PDB code 1gt0 (8)) with Sox2 in green and the POUS and POUHD domains of Oct1 in red and blue, respectively. The purple and green meshes indicate the base pairs changed in DNA_a/DNA_b and DNA_c/DNA_d, respectively. The apparent translocation exchange rates for Sox2, POUS, and POUHD were determined by fitting the time dependence of the exchange and auto cross-peaks in the z-exchange experiment for His-34, Ser-60, and Lys-106, respectively. These three residues exhibit large enough differences in 1HN and 15N chemical shifts between the DNA_a and DNA_b complexes (for His-34 of Sox2) and between the DNA_c and DNA_d complexes (for Ser-60 and Lys-106 of Oct1) to permit accurate quantification of both auto and exchange cross-peak intensities. (C, C terminus; N, N terminus). B, sequences of FGF4-DNA duplexes employed in the z-exchange experiments. DNA_a and DNA_b differ by 1 bp (lilac box) immediately 5′ of the Sox2 binding site and were used to measure Sox2 translocation rates. DNA_c and DNA_d differ by 2 bp (green boxes), one immediately 3′ of the POUS site and the other immediately 3′ of the POUHD site, and were used to measure Oct1 translocation rates. The Sox2 and Oct1 binding sites are delineated by boxes, and the bases that contact the POUS and POUHD domains of Oct1 are indicated by the red and blue bars, respectively. C, examples of z-exchange data for His-34 of Sox2 (left), Ser-60 of POUS (middle), and Lys-106 of POUHD (right) in the Sox2·Oct1·FGF4-DNA ternary complex seen in 1H-15N TROSY-based z-exchange spectra at a mixing time of 220 ms at 30 °C and 150 mm NaCl. For the Sox2 measurements, the concentrations of 2H/15N-labeled Sox2, Oct1 (at natural isotopic abundance), DNA_a, and DNA_b are 0.55, 0.7, 0.35, and 0.35 mm, respectively. For the Oct1 measurements, the concentrations of Sox2 (at natural isotopic abundance), 2H/15N-labeled Oct1, DNA_c, and DNA_d are 0.7, 0.55, 0.35, and 0.35 mm, respectively. D, time dependence of the intensities of auto (filled circles) and exchange (open circles) cross-peaks at 30 °C and 150 mm NaCl together with the best-fit curves (solid lines). The concentrations of proteins and DNA are the same as C. E, dependence of the apparent translocation rates for Sox2 (left), POUS (middle), and POUHD (right) in the ternary complexes (open circles) on the concentration of free DNA at 30 °C and 150 mm NaCl. Also shown are the apparent translocation rates for the corresponding binary complexes (solid circles). The protein concentrations are the same as in C for the ternary complexes; for the binary complexes, the protein at natural isotopic abundance was omitted from the sample. The concentration of free DNA represents the sum of the concentrations of the two DNA duplexes present at a 1:1 ratio in the samples. Association, dissociation, and direct intersegment transfer rate constants derived from the data are summarized in Table 1. F, Eyring plots of the apparent translocation rates at 18, 20, 24, 25, 30, 35, and 40 °C for Sox2 (left), POUS (middle), and POUHD (right) in ternary (open circles) and binary (filled circles) complexes. The protein and DNA concentrations are the same as in C. Linear fits of the apparent translocation rates for the ternary and binary complexes are shown as solid and dashed lines, respectively. Activation enthalpies, entropies, and free energies derived from the data are given in Table 2. Error bars, ± 1 S.D.

