FIGURE 5.
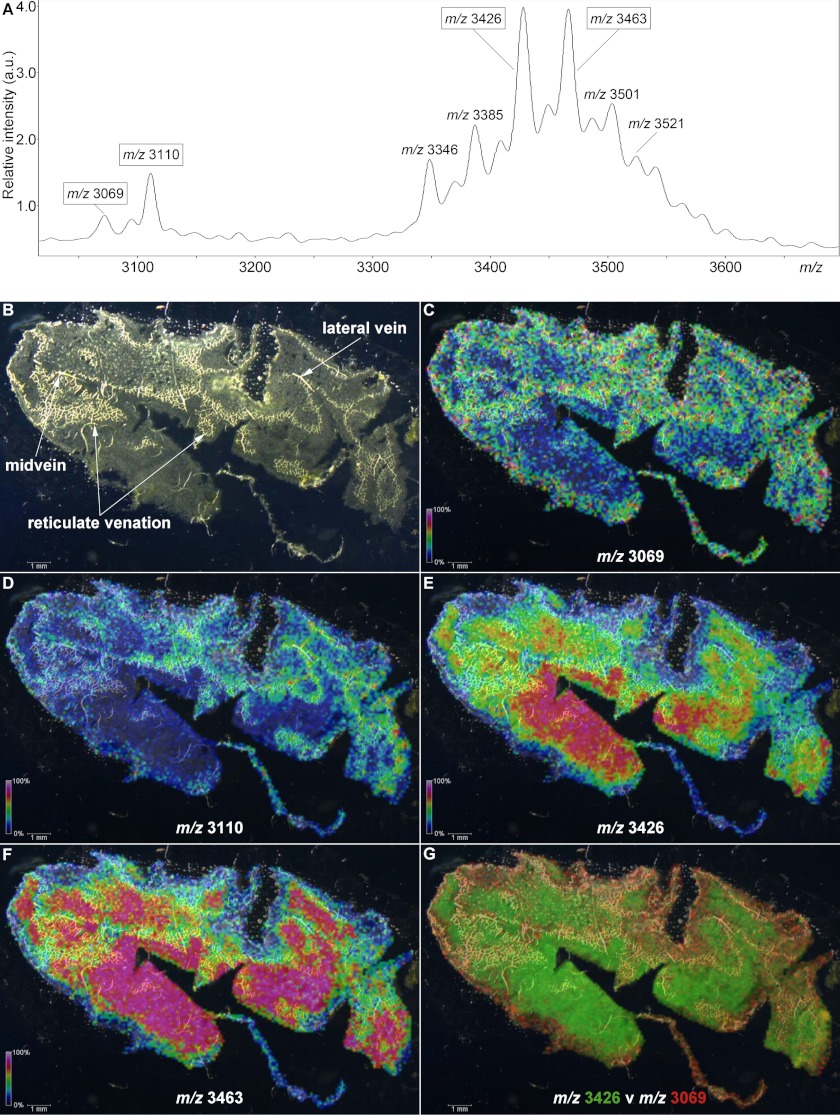
MALDI-MSI of a petunia leaf. The localizations of four distinct m/z signals are indicated with intensity scales relative to average spectrum maximum inset. A, average mass spectrum for the data acquired from the leaf section. B, dark field microscope image of a paradermal (adaxial longitudinal) cryosection of P. x hybrida leaf. C, localization of m/z 3069. D, localization of m/z 3110. E, localization of m/z 3426. F, localization of m/z 3463. G, overlay of m/z 3426 (green) and m/z 3069 (red) signals.

