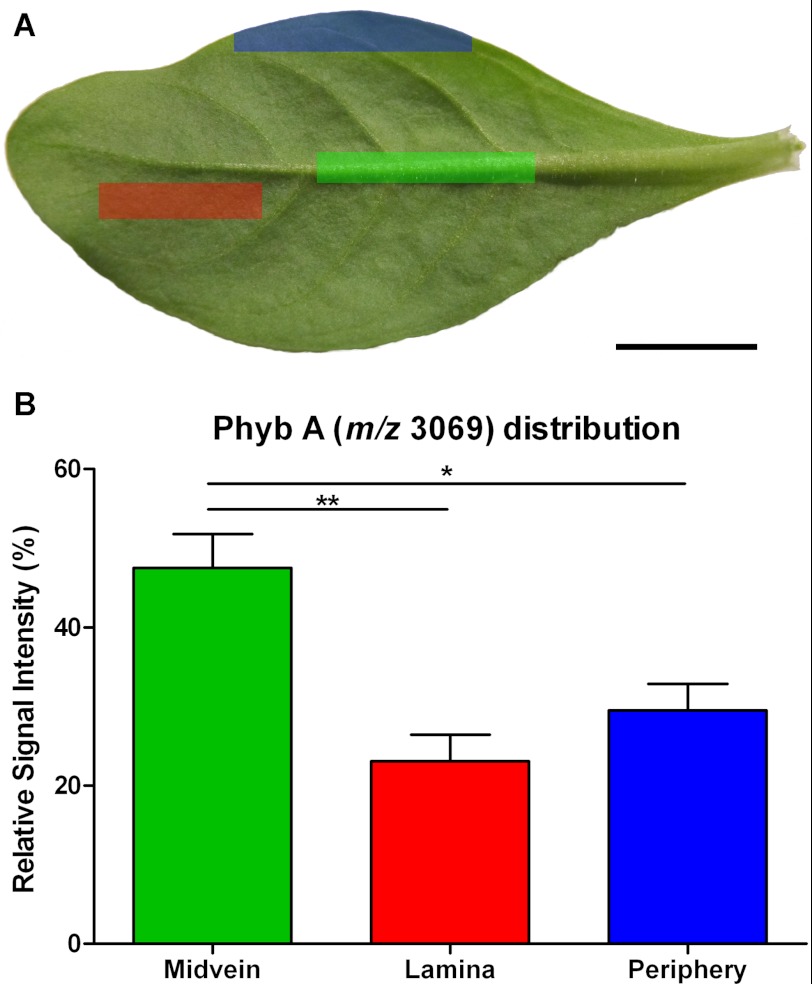
FIGURE 6.
Relative quantitation of Phyb A across petunia leaf regions. A, representative petunia leaf highlighting the regions sampled for LC/MS analysis. Green highlight, midvein; red highlight, lamina; blue highlight, leaf periphery. B, relative extracted ion chromatogram peak intensities for signal at 1535.02+ in LC/MS analyses (corresponds to m/z 3069 in MALDI experiments) of boiled plant extracts. Error bars, S.E. (n = 10). Asterisks denote significant differences at 0.001 < p < 0.01 (**) or 0.01 < p < 0.05 (*) following one-way analysis of variance using Bonferroni's multiple comparison test. Scale bar, 1 cm.

