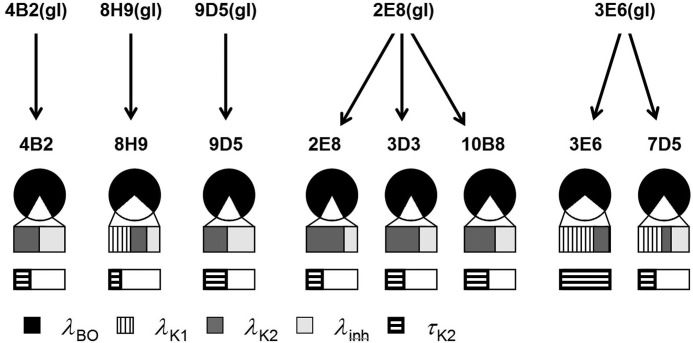
FIGURE 4.
Evolutionary relationships between germ line (top) and affinity-matured (bottom) anti-MPTS Abs. For each Ab, the fractional amplitudes of elastic (λBO) and inelastic fluctuations (λK1,K2 and λinh) are shown in the pie chart and associated expansion, respectively. The bar diagram at the bottom shows the values of the time constant associated with barrier crossing between conformational substates (τK2) for each Ab (normalized to 13 ps). See “Discussion” and Fig. 9 for definitions of the parameters.

