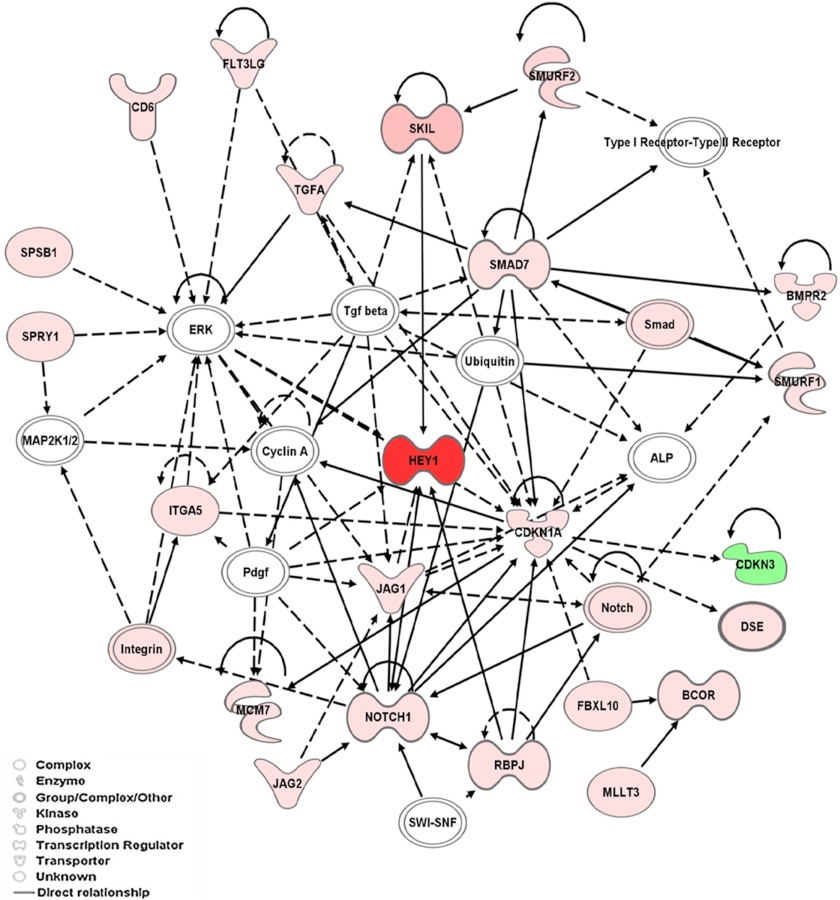
FIGURE 1.
Network pathways analysis of molecules identified in T-cells that are involved in LFA-1/ICAM-1 signaling. Each network is displayed as nodes that represent genes, and edges represent the interactions between genes. The path designer mode was used to generate final network images. Molecules shaded in green indicate a 2-fold or greater decrease in abundance, molecules shaded in red correspond to a 2-fold or greater increase in T-cells following LFA-1/ICAM-1 interactions, and the color intensity corresponds to the degree of abundance. Molecules in white are those identified through the Ingenuity Pathway Knowledgebase. The shapes denote the molecular class of the gene products. A solid line indicates a direct molecular interaction, and a dashed line indicates an indirect molecular interaction.

