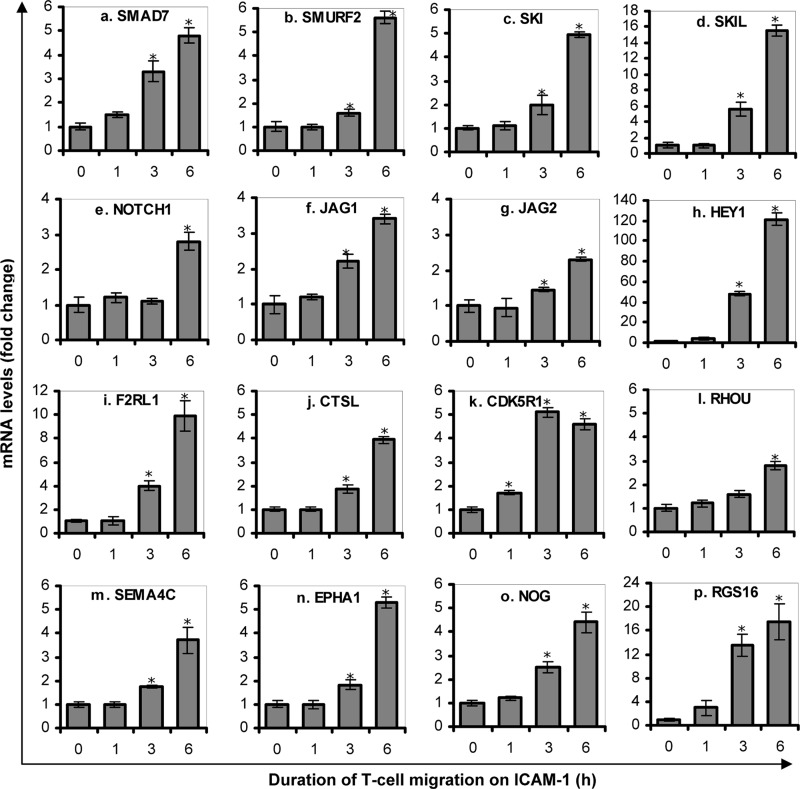
FIGURE 2.
Validation of Affymatrix data for selected genes by qRT-PCR. PBL T-cells purified from healthy volunteers were incubated on ICAM-1-coated plates for 0 h (control), 1, 3, or 6 h. mRNA levels of SMAD7 (a), SMURF2 (b), SKI (c), SKIL (d), NOTCH1 (e), JAG1 (f), JAG2 (g), HEY1 (h), F2RL1 (i), CTSL (j), CDK5R1 (k), RHOU (l), SEMA4C (m), EPHA1 (n), NOG (o), and RGS16 (p) were measured by qRT-PCR. Data are fold change relative to GAPDH (mean ± S.E.) of three independent experiments. *, p < 0.05 with respect to corresponding controls.

