Figure 2.
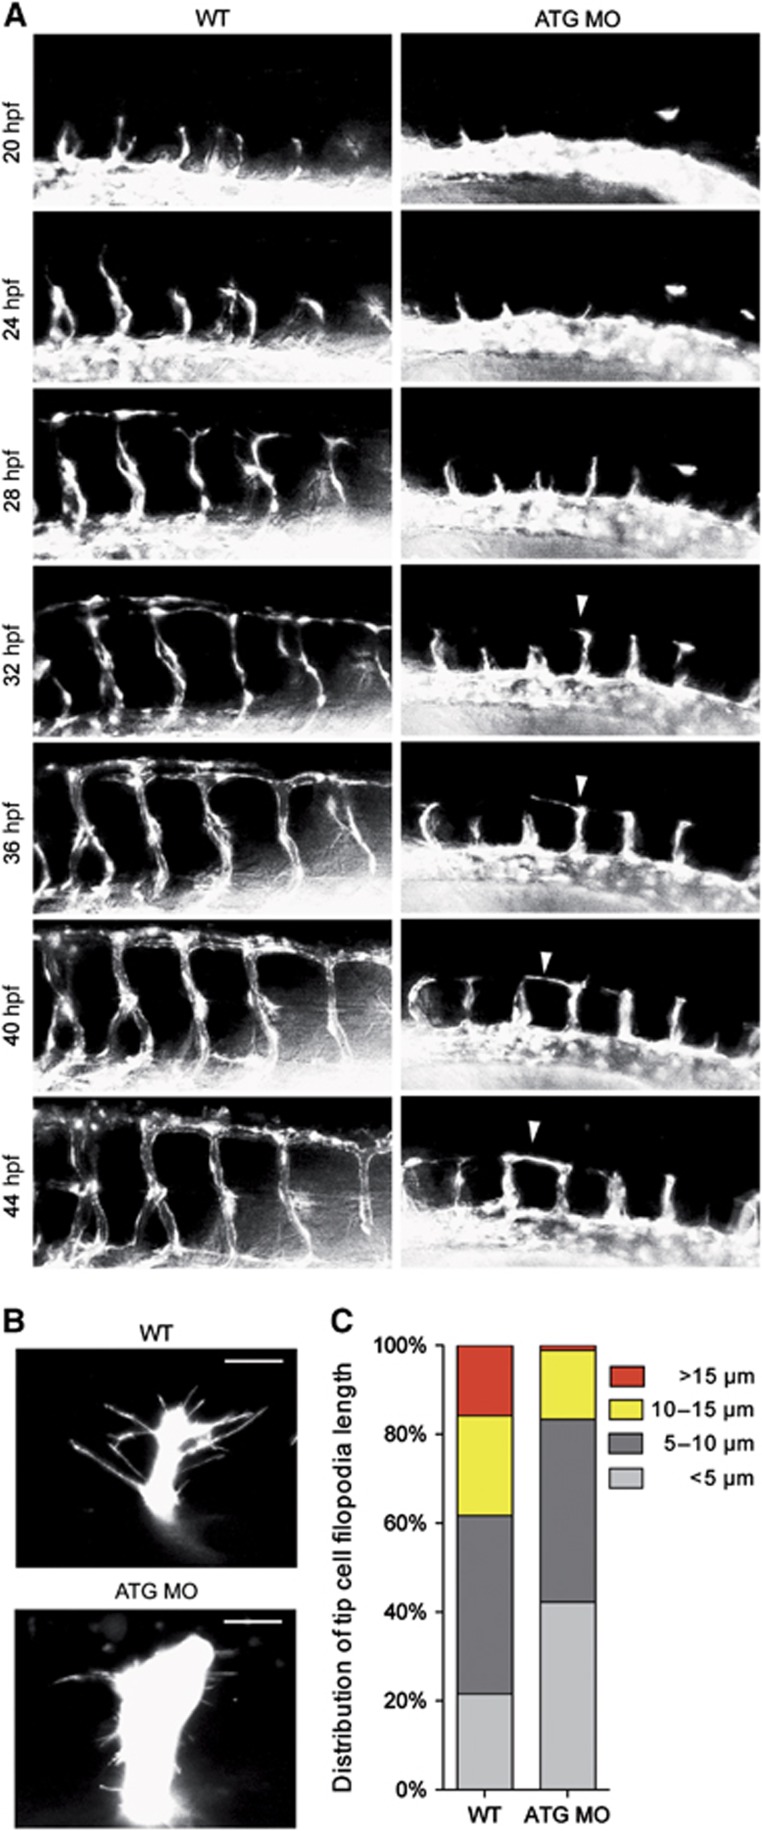
NOSTRIN morphants show an abnormal ISV trajectory phenotype associated with altered tip cell morphology and filopodia length. (A) Time-lapse microscopy of developing ISVs. Images are lateral views with the anterior to the left and the dorsal side up and were extracted from Supplementary Videos 1 (WT) and 2 (ATG MO). Images show developing ISVs and DLAVs in the trunk region of WT Tg(fli1a:EGFP)y1 embryos (left) in comparison to embryos injected with ATG MO (right) visualised by eGFP fluorescence and analysed at the indicated time points between 20 and 44 hpf. The white arrowhead indicates an ISV tip cell in the ATG MO-injected embryo, which did not migrate more dorsally than the level of the horizontal myoseptum after 32 hpf, but extended a prominent protrusion along the longitudinal body axis at approx. 36 hpf. It formed an irregular connection with the neighbouring ISV at the level of the horizontal myoseptum at approx. 42 hpf. (B) Reduced filopodia length of ISV tip cells. CLSM images of leading tip cells of ISV sprouts in the trunk region of WT Tg(kdrl:eGFP)s843 (top) and ATG-MO injected embryos (bottom) visualised by eGFP fluorescence and analysed at 24 hpf. The scale bar represents 15 μm. (C) Distribution of tip cell filopodia length. Analysis of filopodia length in ISV tip cells equivalent to those shown in (B) revealed a reduction in the percentage of long filopodia in the ATG MO-injected embryos in comparison to WT. For analysis of filopodia length images of 6–8 tip cells from 2 WT and 2 ATG MO injected embryos were used.

