Figure 4.
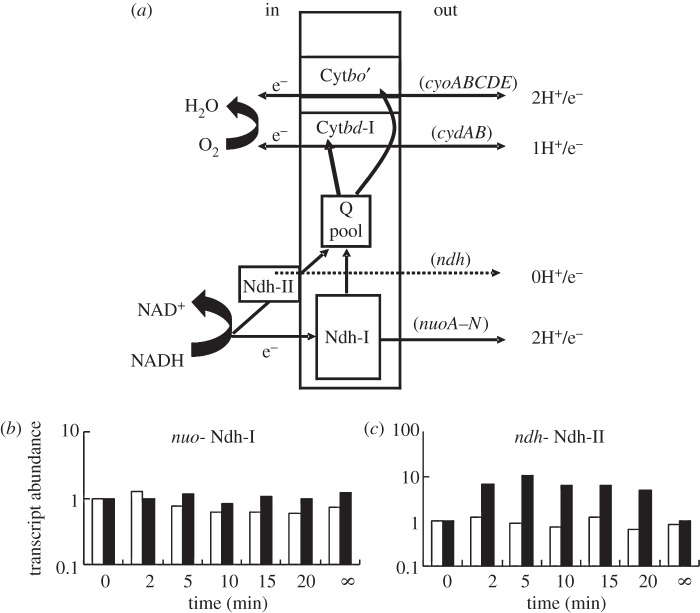
Profiles of transcripts encoding alternative NADH dehydrogenases during adaptation to changes in oxygen availability. (a) Diagram showing the components of the best characterized branched aerobic electron transport chain of E. coli. The central rectangle represents the cytoplasmic membrane. NADH is oxidized by either the proton-translocating NADH dehydrogenase I (Ndh-I, solid line) or by the non-proton-translocating NADH dehydrogenase II (Ndh-II, broken line). Electrons are fed into the quinone pool (Q) and then used by the terminal oxidases (cytochrome bd, Cyt bd-I; or cytochrome bo′, Cyt bo′) in the reduction of oxygen to water. Cyt bo′ has a relatively low affinity for oxygen, whereas Cyt bd-I has a higher affinity for oxygen. Because of the different properties of the dehydrogenases and the oxidases, between one and four protons can be translocated for each electron. (b,c) Transcript profiles of (b) nuoA-N and (c) ndh, during aerobic–anaerobic (white bars) and anaerobic–aerobic (black bars) transitions. Time zero is the aerobic steady state (white bars) or the anaerobic steady state (black bars). The infinity symbol represents the final steady state (anaerobic for the white bars and aerobic for the black bars).

