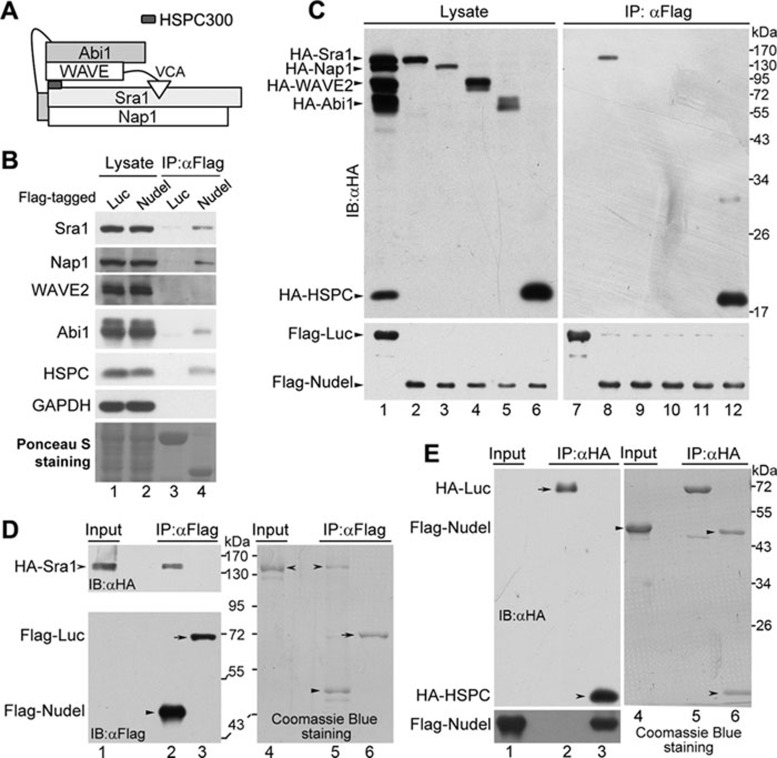
Figure 1.
Interactions between Nudel and the WRC subunits. (A) A schematic architecture of the WRC, mainly based on crystal structure 8. (B) The associations of the WRC subunits with Nudel in vivo. HEK293T cells ectopically expressing Flag-tagged Nudel or firefly luciferase were lysed and subjected to co-IP using the anti-Flag M2 resin. Immunoblotting (IB) was then performed to visualize the indicated proteins, except that the Ponceau S staining of a blot showed the Flag-tagged proteins (lanes 3 and 4). (C) The association between individual WRC subunits and Flag-Nudel. The indicated HA-tagged WRC subunits were coexpressed ectopically with Flag-tagged Nudel or luciferase in HEK293T cells (lanes 1-6). Co-IP was then performed using the anti-Flag M2 resin (lanes 7-12). (D) The direct interaction between Nudel and Sra1. HA-Sra1 ectopically expressed in HEK293T cells was absorbed on the anti-HA resin and then eluted with the HA peptide. The WRC in the eluted proteins was further depleted via incubation with anti-Abi1 antibody immobilized on protein G beads for 1 h. The same amount of the purified HA-Sra1 (lanes 1 and 4) was mixed with Flag-Nudel or Flag-luciferase that was expressed in HEK293T cells and immobilized on the anti-Flag M2 resin. After further incubation on ice for 2 h, the bound proteins were eluted with the Flag peptide. The eluted proteins were visualized by immunoblotting (lanes 2 and 3) and Coomassie Blue staining (lanes 5 and 6) after the SDS-PAGE. (E) The direct interaction between Nudel and HSPC300. Flag-Nudel ectopically expressed in HEK293T cells was purified using the anti-Flag M2 resin and eluted with the Flag peptide (lanes 1 and 4). HA-luciferase and HA-HSPC300 expressed in HEK293T cells were immobilized on the anti-HA resin, respectively, and mixed with the same amount of the purified Flag-Nudel. After further incubation on ice for 2 h, the bound proteins were eluted with the HA peptide. The eluted proteins were visualized by immunoblotting (lanes 2 and 3) and Coomassie Blue staining (lanes 5 and 6) after the SDS-PAGE.

