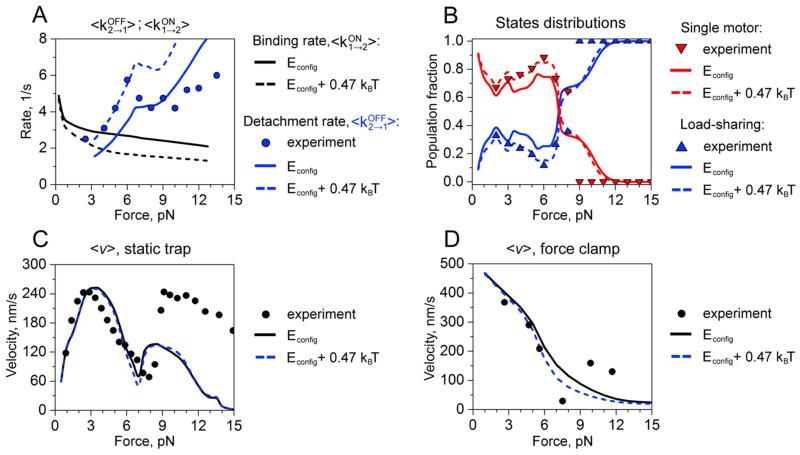
Figure 2.
Dynamic properties of two-kinesin complexes in the model without local interactions. A. Detachment and binding rates: experimentally measured detachment rates are shown by circles, while blue and black curves correspond to calculated values of detachment and binding rates, respectively. B. Distribution of two-motor load-sharing and single-motor bound states as a function of the load. The blue and red triangles represent experimentally measured fractions of load-sharing and single motor states, respectively. Calculated two-motor load sharing and non-load sharing states are shown in blue and red, respectively. C. Force-velocity relationships under static-trap conditions. Symbols correspond to experimental measurements. Black and blue curves describe calculated values for original configurational energies and for modified configurational energies (see text for details), respectively. D. Force-velocity relationships for force-clamp conditions. Symbols correspond to experimental measurements. Black and blue curves describe calculated values for original configurational energies and for modified configurational energies (see text for details), respectively.

