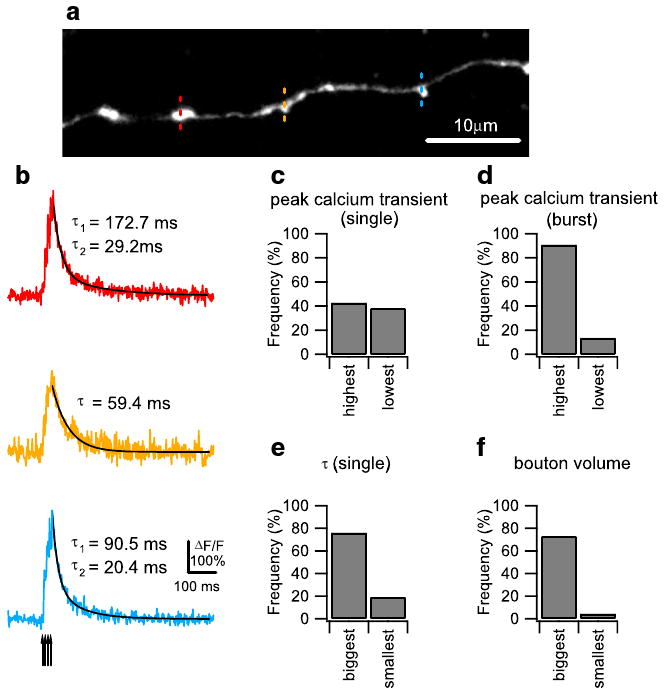
Fig. 2.

Double- and single-exponential decay time course of action potential (AP)-evoked Ca2+ transients in granule cell axonal boutons. a A Z-projection confocal stack image showing a representative dye-loaded parallel fiber (PF). Ca2+ imaging was performed sequentially on three individual boutons indicated by the red, yellow, and blue dotted lines. The confocal stack image was projected by summing pixel intensities. b Burst (four pulses at 100 Hz) AP-evoked Ca2+ transients measured sequentially from three neighboring boutons on the same PF shown in (a). The average traces from five trials are shown. Ca2+ responses were well fit by single-exponential decay curve (yellow) or double-exponential curves (red and blue), shown as superimposed black lines. The arrow indicates the onset of the individual AP during the burst stimulation. Comparison of the frequency of occurrence of double-exponential decay mode of calcium clearance in different groups of granule cell boutons. To divide boutons into two groups based on their single AP-evoked Ca2+ response amplitude and decay time constant and burst AP-evoked Ca2+ response amplitude, we included axons only if the difference between the largest and smallest response was at least 10% of the smallest response. To divide boutons based on volume, we only included axons where the biggest bouton was at least 60% larger in volume compared with the smallest bouton. Bar graphs showing the percentage frequency of boutons exhibiting double-exponential decay time course in groups of boutons divided by single AP-evoked Ca2+ response amplitude (c; 21 axons), burst AP-evoked Ca2+ response amplitude (d; 22 axons), single AP-evoked Ca2+ response decay time constant (e; 21 axons), and bouton volume (f; 22 axons) are presented
