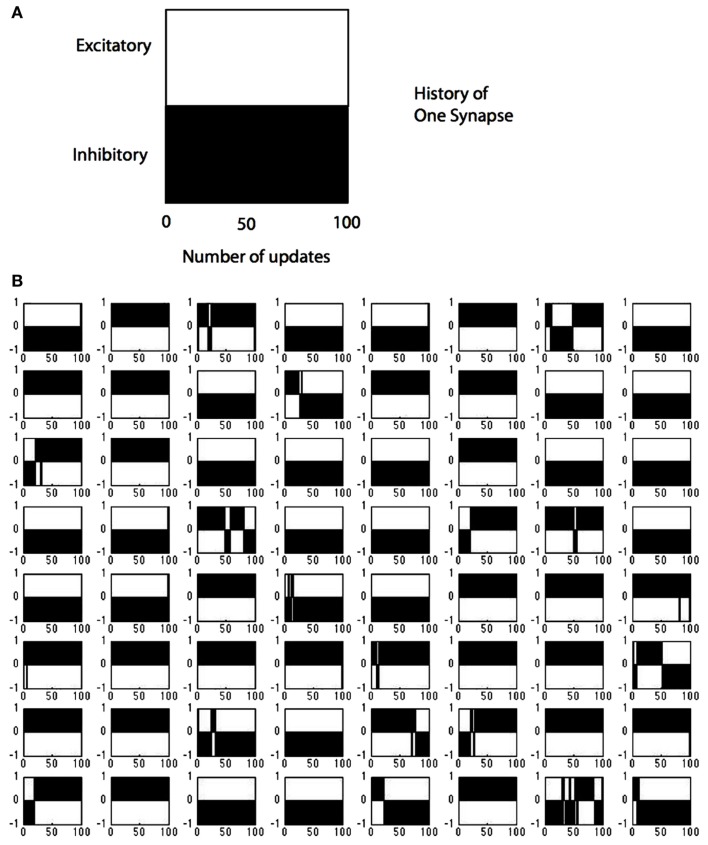
Figure 10.
Tracking the polarity of connections to a single cell. (A) The black portion of the legend denotes the polarity of a synapse (in this case inhibitory) as a function of the number of updates. (B) The state of all 128 possible synapses for a particular model simple cell as a function of the times that it was chosen to represent an input image stimulus. The figure represents two possible synapses at each location. Most locations can be represented by a single synapse that does not change sign, but at 19 positions the synapses need to change sign during the computation, some several times such as synapse position (8,7).

