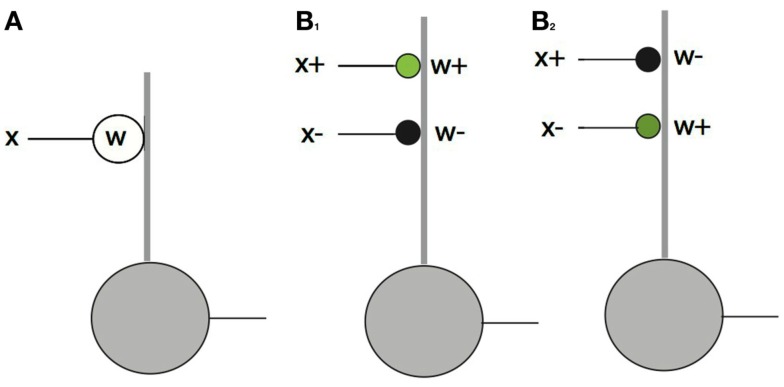
Figure 4.
The feed forward pathway connections. The dot product computation illustrates the difference between conventional neural models and signed labeled lines. In the diagram thick lines denote dendrites and thin lines denote axons. Green circles = excitatory synapses. Black circles = inhibitory synapses. (A) If synapses and inputs could change sign then they could be handled simply with a single contact. (B) In the actual case there are four possibilities, each of which needs a separate synapse. Only one of x+w+ and x+w− can be non-zero at any one time and the same holds for x−w+ and x−w−. Complementary pairs are required be non-zero to faithfully represent a dot product as shown for the cases of B1: x+w+ > 0 and B2: x−w+ > 0.

