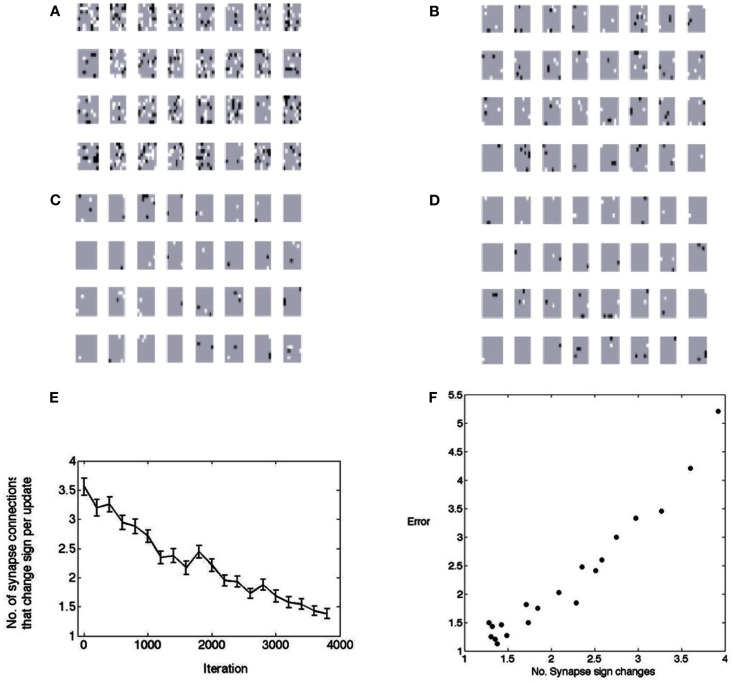
Figure 8.
The changes in polarity of receptive fields during learning. A change from positive to negative is denoted by black and a change from negative to positive is denoted by white. (A) After the first 3,000 image patches. (B) After the second 3,000 image patches. (C) After the third 3,000 image patches. (D) After the forth 3,000 image patches. (E) The points plotted show the average number of synapses that had to change from a base of 256. Fifty samples are used in computing the standard error bars. Thus initially, on every learning update, about 5% of the synapses need to change signs. At the end of learning this number is down to less than 0.5%. (F) The change in synapse polarity is tightly correlated with the residual error in fitting receptive fields (r = 0.97), suggesting that the changes in polarity can be used to track the progress of receptive field formation.

