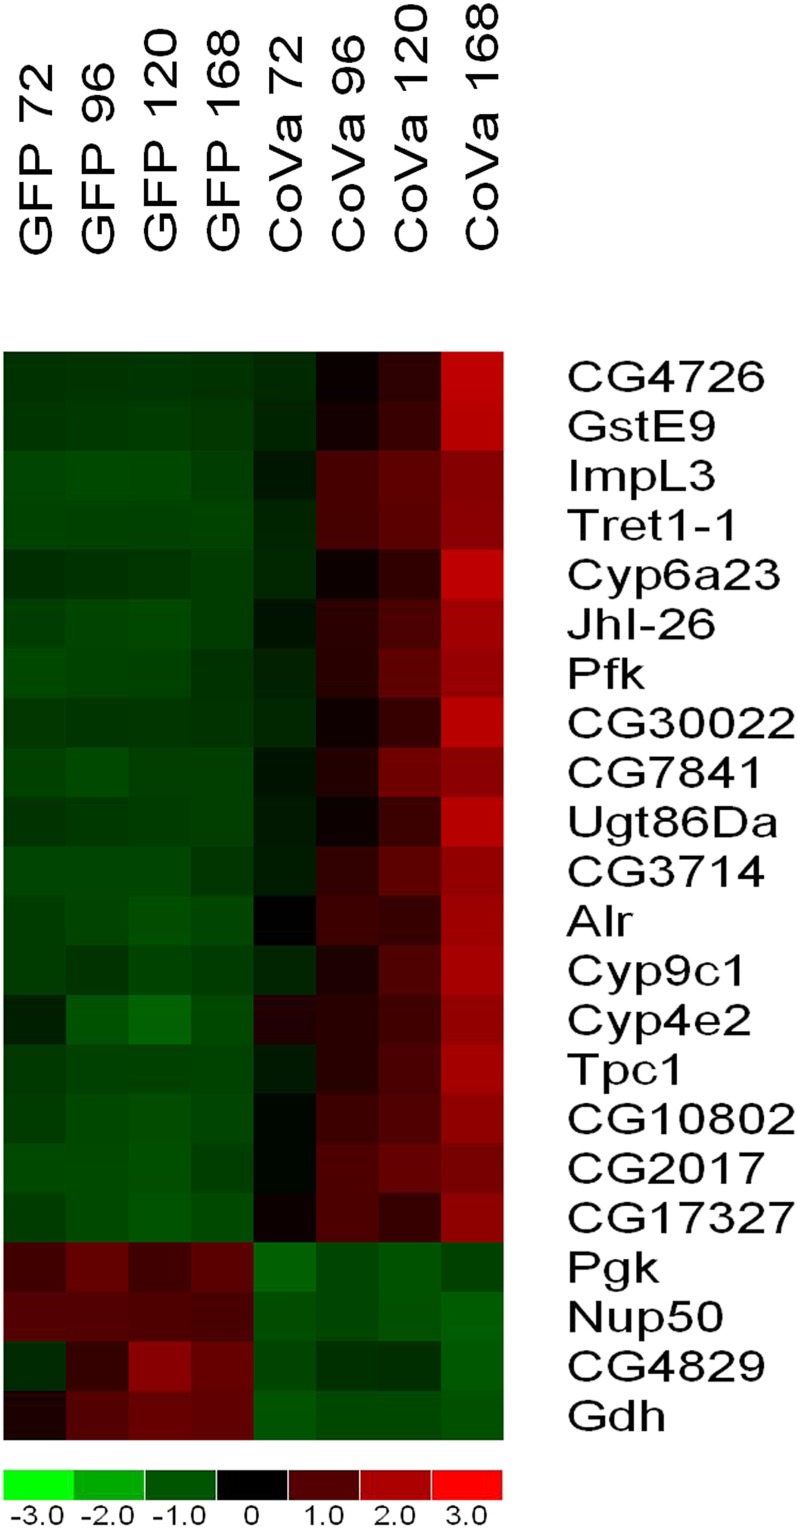
Figure 2.
Microarray expression profiling identifies genes differentially expressed by CoVa knockdown in Drosophila S2 cells. Using microarray-based transcriptional profiling, 22 genes are identified to be differentially expressed as a result of CoVa knockdown in Drosophila S2 cells (see text for comparison criteria). Listed from left to right are the time-course samples of S2 cells with GFP indicating control and CoVa indicating CoVa knockdown. The number following the identifier is the number of hours after RNA interference was initiated. Listed from top to bottom are genes most highly upregulated to most highly downregulated. The color map bar on the bottom of the figure displays fold change of the gene expression, with red indicating a fold change of 1 or more, and green indicating a fold change of −1 or less. For a description of the specific genes, see the Results and Discussion sections.

