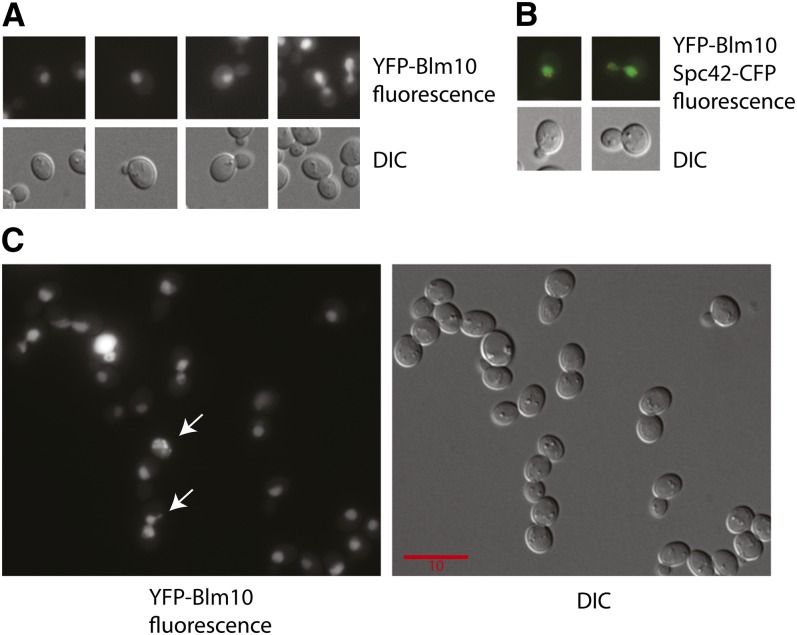
Figure 6 .
Nuclear localization and colocalization of Blm10. Shown are representative YFP and differential interference contrast (DIC) images of living cells. The scale bar applies for all images in the panels as all images are scaled equally. Representative cells from populations of 4000 to 10,000 cells are shown to illustrate the following: (A) Nuclear localization, showing progression from unbudded to large-budded cells. (B) Colocalization of nuclear Spc42-CFP and YFP-Blm10. (C) Nuclear localization after growth on medium supplemented with 20 μg/mL phleomycin D1. Arrows indicate cells with evidence for nuclear membrane fragmentation.

