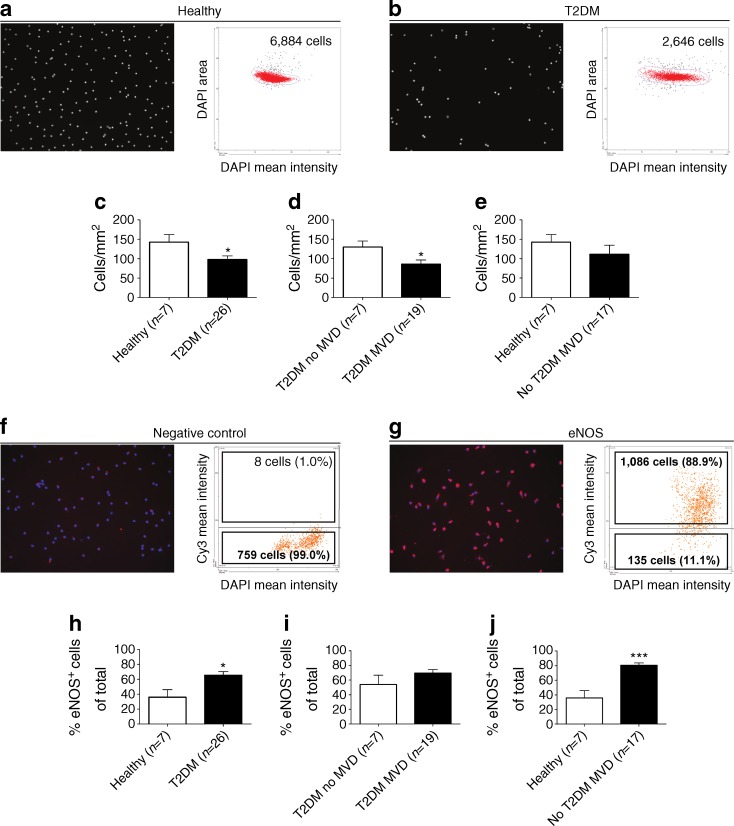
Fig. 4.
CAC outgrowth in culture is reduced in type 2 diabetic patients. (a,b) Representative images and corresponding scatterplots of DAPI-stained CAC nuclei, which were quantified with the TissueFAXS system. The scatterplots show the total number of nuclei that were quantified in a fixed region in a representative healthy control (a) and a type 2 diabetic patient without MVD (b). (c) CAC outgrowth was reduced 1.5-fold in type 2 diabetic patients compared with healthy controls. (d) Within type 2 diabetic individuals, patients with MVD displayed a 1.5-fold reduction in the number of outgrowth CACs compared with type 2 diabetic patients without MVD. (e) Within non-type 2 diabetic individuals, similar CAC levels were observed in individuals with and without MVD. (f,g) The presence of eNOS was assessed using TissueFAXS analysis: (f) negative control staining; and (g) eNOS staining. (h) The percentage of CACs containing eNOS was increased in type 2 diabetic patients compared with healthy controls (h), but not according to MVD status in type 2 diabetic patients (i). (j) Individuals with MVD but not type 2 diabetes had significantly higher frequencies of CACs containing eNOS compared with healthy controls. Data are expressed as mean values ± SEM; *p < 0.05, ***p < 0.001. T2DM, type 2 diabetes mellitus

