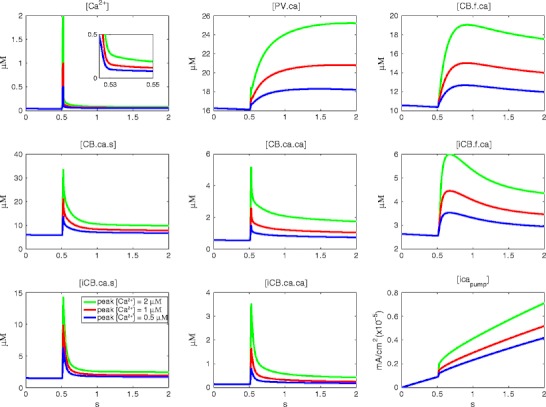
Fig. 2.

Intracellular Ca2+ profiles simulated using the depolarization command shown in Fig. 1a, for different amplitudes of Ca2+ influx (indicated by color). The panels show, respectively, Ca2+ concentration ([Ca2+]), Ca2+ bound to PV (PV.ca), Ca2+ bound to slow binding site of CB (CB.f.ca), Ca2+ bound to fast binding site of CB (CB.ca.s), Ca2+ bound to fast and slow binding sites (CB.ca.ca), Ca2+ bound to slow binding site of immobile CB (iCB.f.ca), Ca2+ bound to fast binding site of immobile CB (iCB.ca.s), Ca2+ bound to fast and slow binding sites (iCB.ca.ca), and pump current over a period of 2,000 ms
