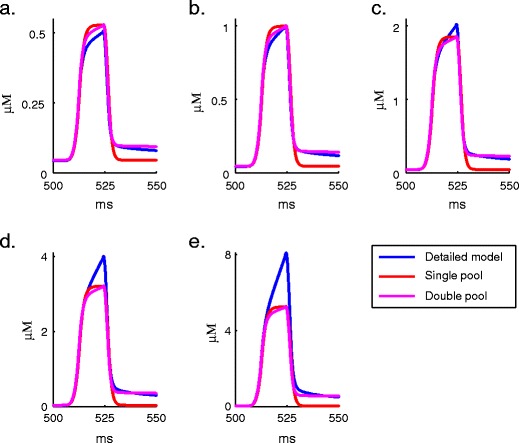
Fig. 3.

Comparison of Ca2+ profiles generated with a voltage step protocol using single pool, double pool (parameters specified in the text), and detailed dynamics model. Different Ca2+ concentration peak amplitudes of a 0.5, b 1, c 2, d 4, and e 8 μM were simulated to demonstrate the problems the single pool or double pool models have in capturing the complex dynamics of the detailed model. See text for parameters of the pool models
