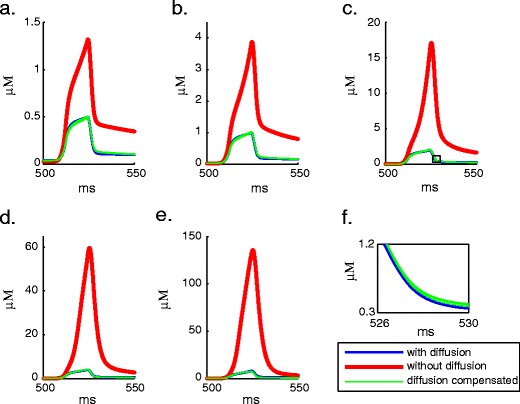
Fig. 4.

Comparison of Ca2+ profiles of different peak amplitudes, a 0.5, b 1, c 2, d 4, and e 8 μM, simulated in a compartment with a diameter of 2 μm, using the detailed Ca2+ dynamics model, detailed Ca2+ dynamics model without diffusion, and DCM model. The removal of diffusion from the detailed model resulted in a steep rise in Ca2+, which could be well compensated by DCM. The inset (f) below the panel (c) highlights Ca2+ profiles simulated using five different sets of optimal DCM parameters found by using Neurofitter
