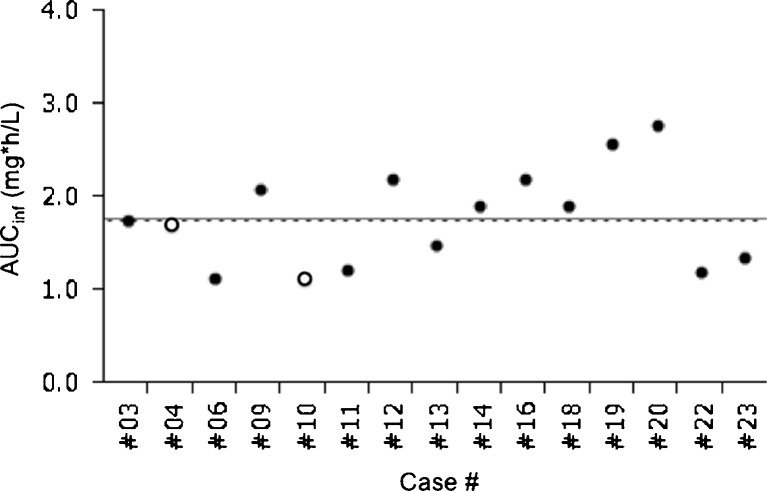
Fig. 2.
Area under the blood concentration time curve (AUC) for docetaxel administered at 40 mg/m2 was plotted for patients who met the evaluation criteria for frozen glove efficacy and pharmacokinetics. Straight lines and broken lines indicate mean and median values, respectively. Open circles represent data from patients who developed DNT and closed circles from patients without DNT. This figure was created using the Microsoft Office Powerpoint and JMP program. AUC inf area under the blood concentration time curve extrapolated to infinity

