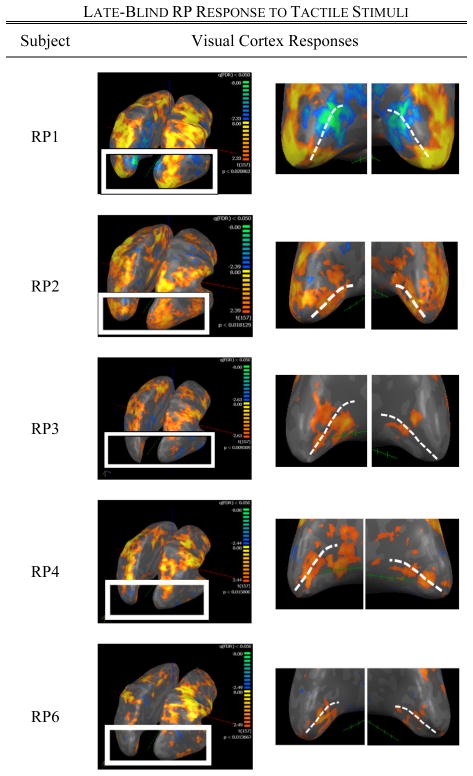
Fig. 2.
BOLD responses to the sandpaper task in five late-blind RP subjects. For each subject, the image on the left illustrates activation patterns throughout an inflated representation of the whole brain, while the image on the right shows subjects’ visual cortex responses (the white dotted line represents the location of the calcarine sulcus, with its posterior end at the occipital pole).

