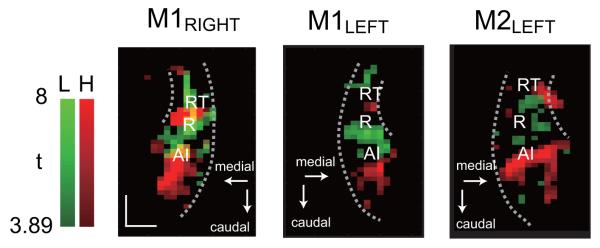
Figure 2.
Maximum projection map of the tonotopic representations in each hemisphere — M1 right, M1 left, and M2 left. Maps were derived from positive BOLD responses at 80 dB (M1 left, HFT at 75dB) collapsed across 4 slices through the depth of the STP and thresholded at t = 3.89. Areas activated by high and low frequency tones are shown in red and green, respectively; overlap between the two in M1 right is shown in yellow. The long dotted arc on each collapsed slice marks the lateral edge of the STP, and the short dotted arc marks the circular sulcus, which forms the medial edge of rostral STP. Positions of A1, R, and RT were estimated based on mirror reversals of the tonotopic representations: high to low in A1, low to high in R, and high to low again in RT. Abbreviations: H, high frequency tones; L, low frequency tones. Scale bar, 5 mm.

