
Figure 8.
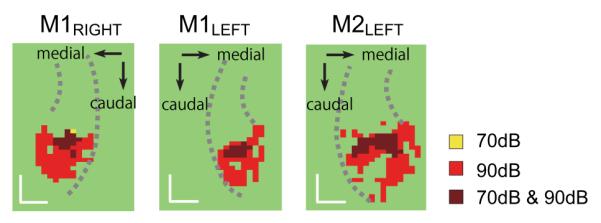
Clusters in the maximum projection map (Fig. 2) of putative A1 and surrounding belt areas in response to high frequency tones presented at 70 dB and 90 dB (80dB in M1 left) plotted separately and together. Spread of activation in all directions except rostrally was prominent in each hemisphere as the sound level increased. Note that only a single voxel (M1 right) was activated at 70 dB but not at 90 dB. Scale bar, 5 mm. (For further description, see legend to Fig. 2.)