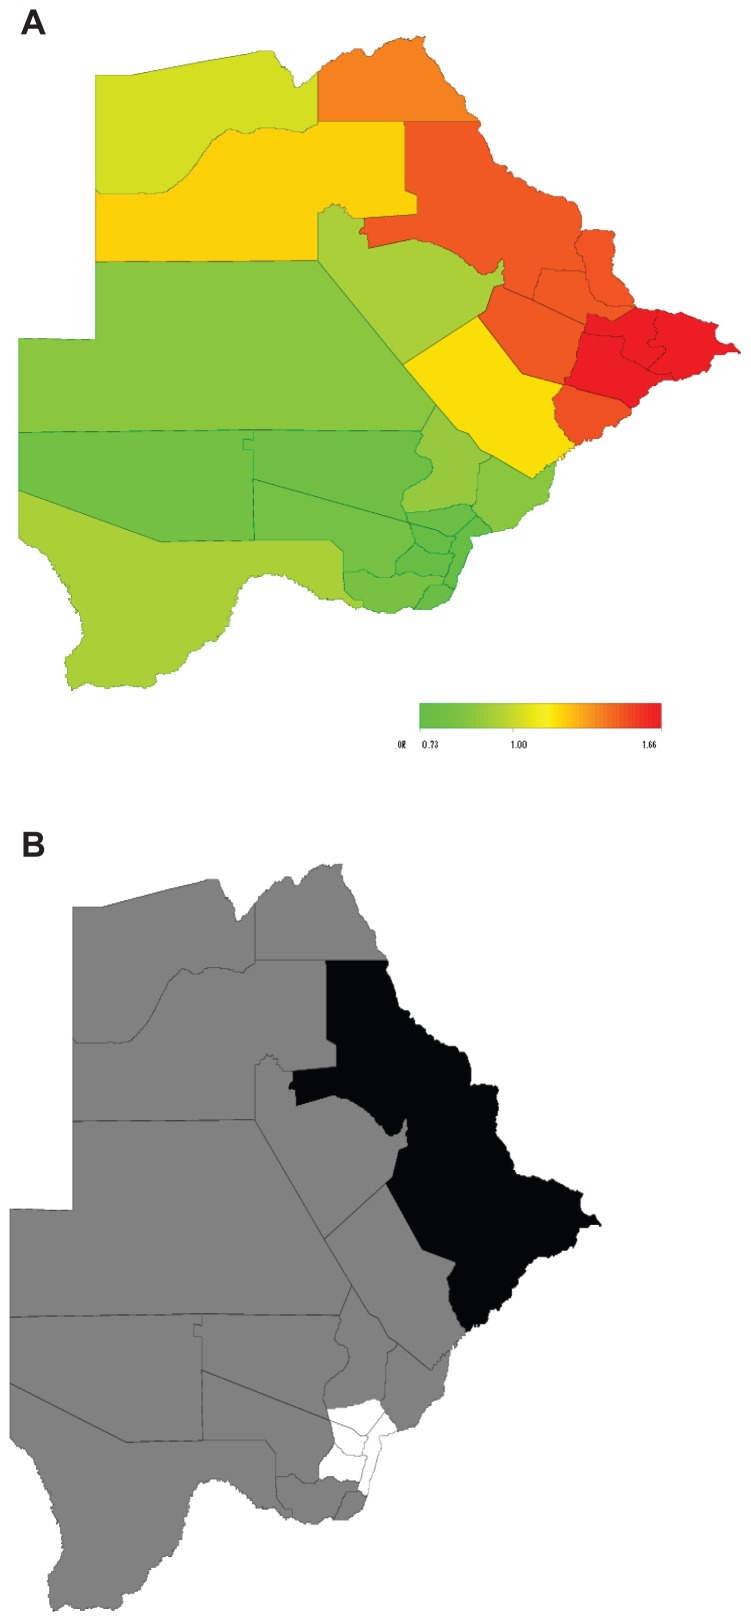
Figure 2.
Total residual district spatial effects (A) and 95% posterior probability map (B) of the risk of HIV infection in Botswana.3
Notes: (A) Red, high risk (OR: 1.66); green, low risk (OR: 0.73). (B) Black, positive spatial association (high risk); white, negative spatial association (low risk); grey, no spatial association.
Abbreviations: OR, odds ratio.

