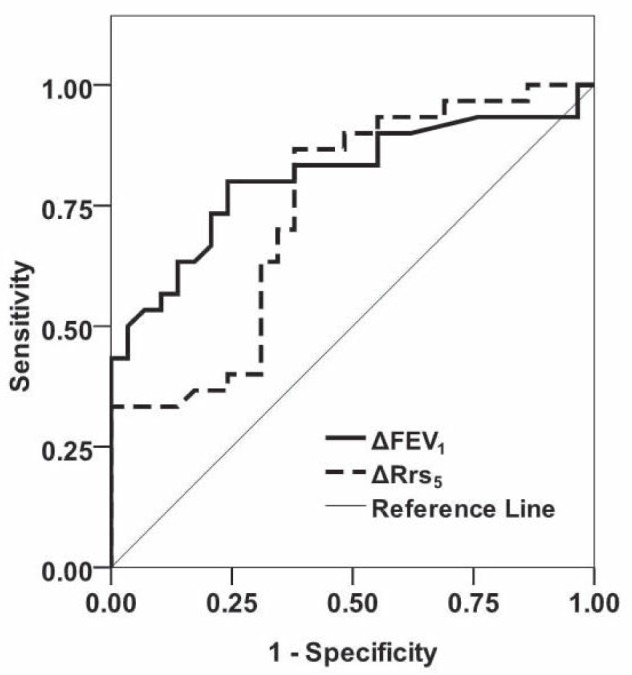
Figure 1).

ROC curve showing relationship between sensitivity and 1– specificity of changes in spirometry (solid line) and in impulse oscillometry – assessed bronchodilator response of resistance at 5 Hz (Rrs5) (dashed line) to detect clinical asthma. FEV1 Forced expiratory volume in 1 s
