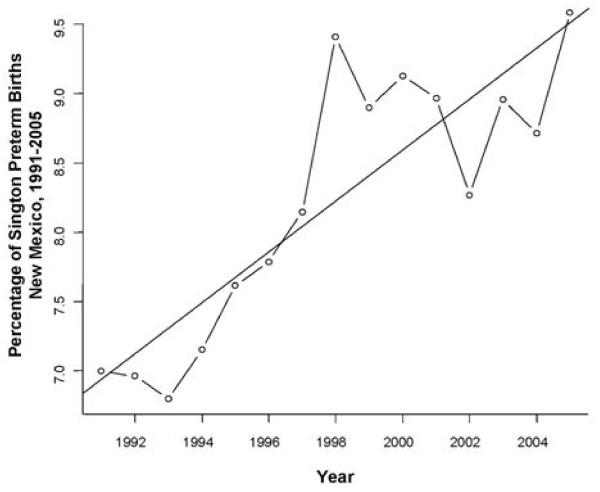
Figure 1.
Rate of PTB among singleton deliveries in New Mexico, 1991-2005. The rate of PTB in New Mexico between 1991-2005 was assessed by treating year as a continuous variable and examining the coefficient of that variable by logistic regression. A linear trend of increasing PTB over time was observed.

