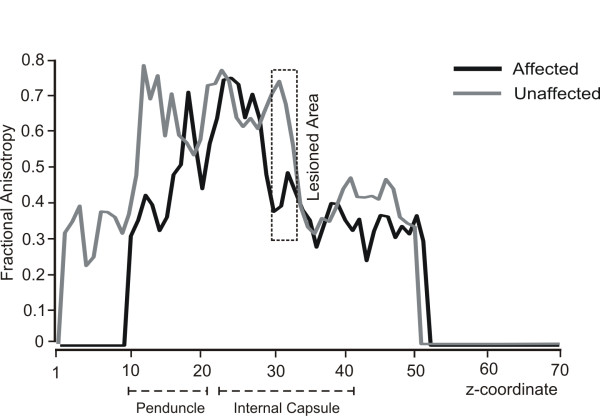
Figure 9.
Slice-by-slice FA values of the ipsilesional (black) and contralesional (gray) pyramidal tracts. FA values of slices from the lesioned area on the affected hemisphere are enclosed in a dashed square. Note the differential FA values between lesioned and unlesioned track in peduncle and internal capsule regions.

