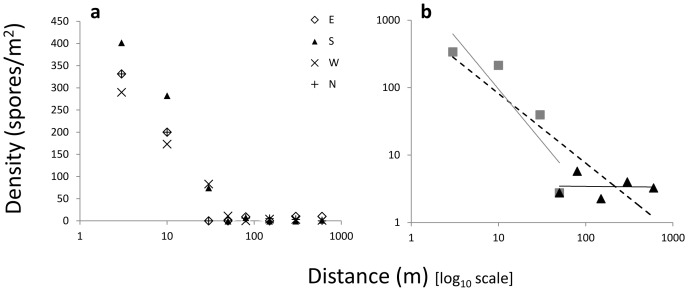
Figure 2. The estimated spore densities, based on the observed number of colonised pots, at different distances.
a. Spore densities (on a linear scale) for the four cardinal directions (distances on a logarithmic scale). b. The mean spore densities at each distance (in log-log space). Power trend lines are shown both for the full data (hatched) and for distances within and beyond 40–50 m separately. The regression coefficients b are −1.032 for the full data set (5–600 m), −1.563 for 5 to 50 m and −0.012 for 50 to 600 m.

