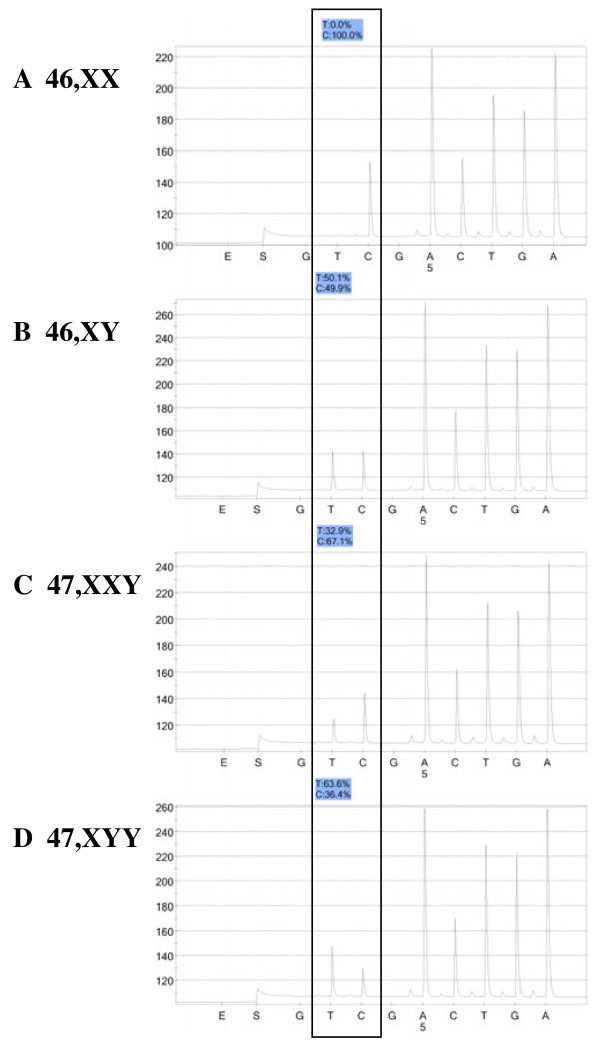
Figure 1.
Pyrograms for DNA from a 46,XX female (A), a 46,XY male (B), a 47,XXY KS male (C), and a 47,XYY male (D) using the XYM3 assay. The box encloses the two nucleotide dispensations which define the C/T SNP; the C-allele is derived from the X-chromosome and the T-allele is from the Y-chromosome. The percent of each allele is shown in the shaded box above each pyrogram. The y-axis depicts the intensity of light signal in arbitrary units and the x-axis shows the time of addition of Pyrosequnecing enzymes (E), substrates (S), and each individual nucleotide dispensation (A, C, G, or T).

