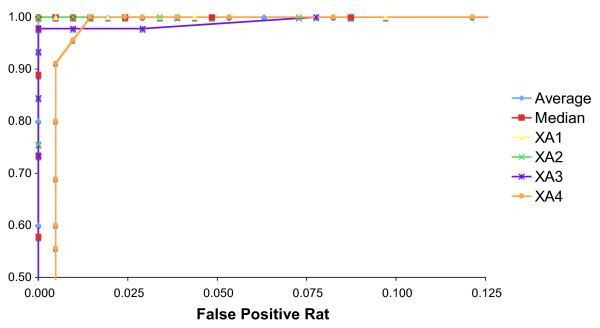
Figure 6.
Receiver operator characteristic curves for detection of 48,XXYY syndrome. The average and median of the four XA marker data points for each sample was calculated: either the average, median or individual marker data was compared to the threshold for detecting 48,XXYY syndrome. The threshold was varied by 1% increments from 33-52% X allele signal. The sensitivity (TP/(TP + FN)) and false positive rate (FP/(FP + TN)) were calculated for each value of the appropriate threshold. True positives (TP) have a 48,XXYY karyotype and X allele signal greater than the threshold; false negatives (FN) have the same karyotype and X allele signal less than or equal to the threshold. True negatives (TN) have a 46,XY karyotype and X allele signal less than or equal to the threshold; false positives (FP) have a 46,XY karyotype and X allele signal above the threshold.

